- Taiwan
- /
- Electronic Equipment and Components
- /
- TWSE:3583
Scientech's (TWSE:3583) three-year total shareholder returns outpace the underlying earnings growth


Generally speaking, investors are inspired to be stock pickers by the potential to find the big winners. Not every pick can be a winner, but when you pick the right stock, you can win big. One such superstar is Scientech Corporation (TWSE:3583), which saw its share price soar 535% in three years. Also pleasing for shareholders was the 22% gain in the last three months. But this move may well have been assisted by the reasonably buoyant market (up 17% in 90 days). We love happy stories like this one. The company should be really proud of that performance!
In light of the stock dropping 7.7% in the past week, we want to investigate the longer term story, and see if fundamentals have been the driver of the company's positive three-year return.
See our latest analysis for Scientech
While markets are a powerful pricing mechanism, share prices reflect investor sentiment, not just underlying business performance. By comparing earnings per share (EPS) and share price changes over time, we can get a feel for how investor attitudes to a company have morphed over time.
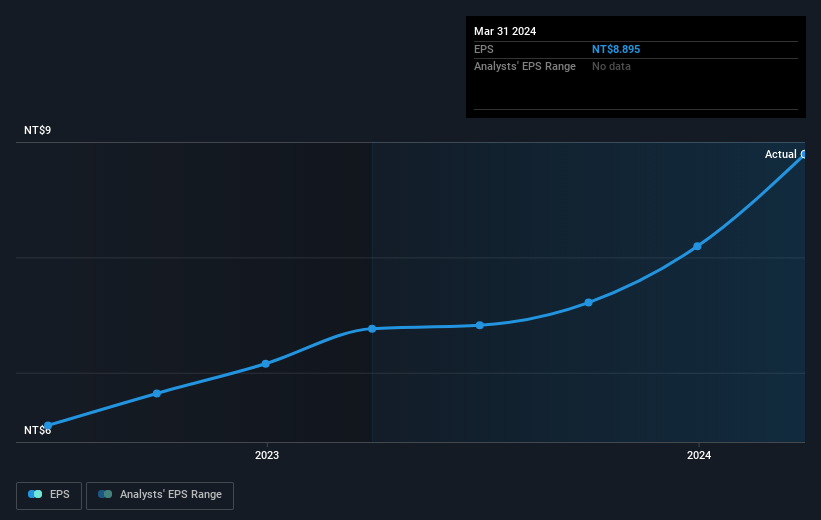
Scientech was able to grow its EPS at 30% per year over three years, sending the share price higher. This EPS growth is lower than the 85% average annual increase in the share price. So it's fair to assume the market has a higher opinion of the business than it did three years ago. It is quite common to see investors become enamoured with a business, after a few years of solid progress.
You can see how EPS has changed over time in the image below (click on the chart to see the exact values).
This free interactive report on Scientech's earnings, revenue and cash flow is a great place to start, if you want to investigate the stock further.
What About Dividends?
It is important to consider the total shareholder return, as well as the share price return, for any given stock. The TSR incorporates the value of any spin-offs or discounted capital raisings, along with any dividends, based on the assumption that the dividends are reinvested. Arguably, the TSR gives a more comprehensive picture of the return generated by a stock. As it happens, Scientech's TSR for the last 3 years was 578%, which exceeds the share price return mentioned earlier. And there's no prize for guessing that the dividend payments largely explain the divergence!
A Different Perspective
It's good to see that Scientech has rewarded shareholders with a total shareholder return of 105% in the last twelve months. Of course, that includes the dividend. That gain is better than the annual TSR over five years, which is 44%. Therefore it seems like sentiment around the company has been positive lately. Given the share price momentum remains strong, it might be worth taking a closer look at the stock, lest you miss an opportunity. While it is well worth considering the different impacts that market conditions can have on the share price, there are other factors that are even more important. Case in point: We've spotted 1 warning sign for Scientech you should be aware of.
We will like Scientech better if we see some big insider buys. While we wait, check out this free list of undervalued stocks (mostly small caps) with considerable, recent, insider buying.
Please note, the market returns quoted in this article reflect the market weighted average returns of stocks that currently trade on Taiwanese exchanges.
New: Manage All Your Stock Portfolios in One Place
We've created the ultimate portfolio companion for stock investors, and it's free.
• Connect an unlimited number of Portfolios and see your total in one currency
• Be alerted to new Warning Signs or Risks via email or mobile
• Track the Fair Value of your stocks
Have feedback on this article? Concerned about the content? Get in touch with us directly. Alternatively, email editorial-team (at) simplywallst.com.
This article by Simply Wall St is general in nature. We provide commentary based on historical data and analyst forecasts only using an unbiased methodology and our articles are not intended to be financial advice. It does not constitute a recommendation to buy or sell any stock, and does not take account of your objectives, or your financial situation. We aim to bring you long-term focused analysis driven by fundamental data. Note that our analysis may not factor in the latest price-sensitive company announcements or qualitative material. Simply Wall St has no position in any stocks mentioned.
Have feedback on this article? Concerned about the content? Get in touch with us directly. Alternatively, email editorial-team@simplywallst.com
About TWSE:3583
Scientech
Engages in the research and development, production, sale, and maintenance of process equipment for semiconductors, liquid crystal displays (LCDs), light-emitting diodes (LEDs), and solar power generation industries.
Excellent balance sheet with proven track record.

