- Taiwan
- /
- Tech Hardware
- /
- TWSE:3013
Chenming Electronic Tech's (TWSE:3013) 81% CAGR outpaced the company's earnings growth over the same three-year period


We think that it's fair to say that the possibility of finding fantastic multi-year winners is what motivates many investors. But when you hold the right stock for the right time period, the rewards can be truly huge. One such superstar is Chenming Electronic Tech. Corp. (TWSE:3013), which saw its share price soar 472% in three years. Also pleasing for shareholders was the 84% gain in the last three months.
Since it's been a strong week for Chenming Electronic Tech shareholders, let's have a look at trend of the longer term fundamentals.
See our latest analysis for Chenming Electronic Tech
While the efficient markets hypothesis continues to be taught by some, it has been proven that markets are over-reactive dynamic systems, and investors are not always rational. By comparing earnings per share (EPS) and share price changes over time, we can get a feel for how investor attitudes to a company have morphed over time.
During three years of share price growth, Chenming Electronic Tech achieved compound earnings per share growth of 48% per year. In comparison, the 79% per year gain in the share price outpaces the EPS growth. This indicates that the market is feeling more optimistic on the stock, after the last few years of progress. It is quite common to see investors become enamoured with a business, after a few years of solid progress. This favorable sentiment is reflected in its (fairly optimistic) P/E ratio of 63.08.
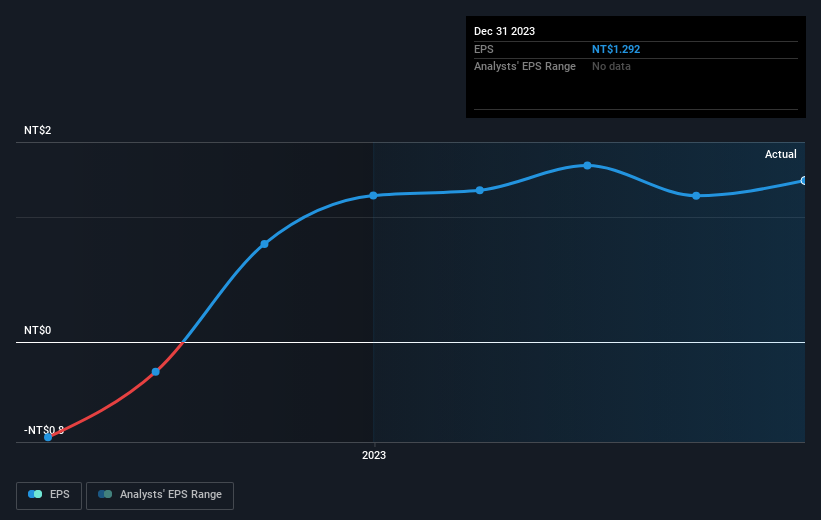
The graphic below depicts how EPS has changed over time (unveil the exact values by clicking on the image).
Dive deeper into Chenming Electronic Tech's key metrics by checking this interactive graph of Chenming Electronic Tech's earnings, revenue and cash flow.
What About Dividends?
When looking at investment returns, it is important to consider the difference between total shareholder return (TSR) and share price return. The TSR is a return calculation that accounts for the value of cash dividends (assuming that any dividend received was reinvested) and the calculated value of any discounted capital raisings and spin-offs. So for companies that pay a generous dividend, the TSR is often a lot higher than the share price return. In the case of Chenming Electronic Tech, it has a TSR of 490% for the last 3 years. That exceeds its share price return that we previously mentioned. The dividends paid by the company have thusly boosted the total shareholder return.
A Different Perspective
It's nice to see that Chenming Electronic Tech shareholders have received a total shareholder return of 240% over the last year. And that does include the dividend. That gain is better than the annual TSR over five years, which is 41%. Therefore it seems like sentiment around the company has been positive lately. Someone with an optimistic perspective could view the recent improvement in TSR as indicating that the business itself is getting better with time. It's always interesting to track share price performance over the longer term. But to understand Chenming Electronic Tech better, we need to consider many other factors. To that end, you should be aware of the 1 warning sign we've spotted with Chenming Electronic Tech .
If you would prefer to check out another company -- one with potentially superior financials -- then do not miss this free list of companies that have proven they can grow earnings.
Please note, the market returns quoted in this article reflect the market weighted average returns of stocks that currently trade on Taiwanese exchanges.
New: AI Stock Screener & Alerts
Our new AI Stock Screener scans the market every day to uncover opportunities.
• Dividend Powerhouses (3%+ Yield)
• Undervalued Small Caps with Insider Buying
• High growth Tech and AI Companies
Or build your own from over 50 metrics.
Have feedback on this article? Concerned about the content? Get in touch with us directly. Alternatively, email editorial-team (at) simplywallst.com.
This article by Simply Wall St is general in nature. We provide commentary based on historical data and analyst forecasts only using an unbiased methodology and our articles are not intended to be financial advice. It does not constitute a recommendation to buy or sell any stock, and does not take account of your objectives, or your financial situation. We aim to bring you long-term focused analysis driven by fundamental data. Note that our analysis may not factor in the latest price-sensitive company announcements or qualitative material. Simply Wall St has no position in any stocks mentioned.
About TWSE:3013
Chenming Electronic Tech
An OEM/ODM manufacturer, engages in the research and development, manufacturing, and sale of computer and server cases, server chassis, mobile device components, and molds in Taiwan, China, the United States, and internationally.
Flawless balance sheet with high growth potential.

