- Taiwan
- /
- Tech Hardware
- /
- TWSE:2059
King Slide Works' (TWSE:2059) earnings growth rate lags the 35% CAGR delivered to shareholders


When you buy shares in a company, it's worth keeping in mind the possibility that it could fail, and you could lose your money. But on the bright side, if you buy shares in a high quality company at the right price, you can gain well over 100%. For example, the King Slide Works Co., Ltd. (TWSE:2059) share price has soared 294% in the last half decade. Most would be very happy with that. On the other hand, the stock price has retraced 6.9% in the last week.
Although King Slide Works has shed NT$9.1b from its market cap this week, let's take a look at its longer term fundamental trends and see if they've driven returns.
View our latest analysis for King Slide Works
In his essay The Superinvestors of Graham-and-Doddsville Warren Buffett described how share prices do not always rationally reflect the value of a business. One flawed but reasonable way to assess how sentiment around a company has changed is to compare the earnings per share (EPS) with the share price.
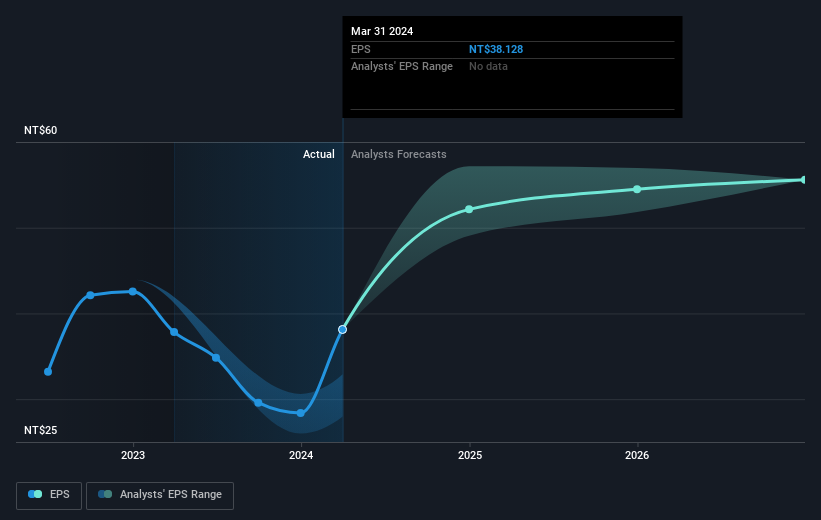
During five years of share price growth, King Slide Works achieved compound earnings per share (EPS) growth of 14% per year. This EPS growth is slower than the share price growth of 32% per year, over the same period. So it's fair to assume the market has a higher opinion of the business than it did five years ago. And that's hardly shocking given the track record of growth.
The image below shows how EPS has tracked over time (if you click on the image you can see greater detail).
We know that King Slide Works has improved its bottom line over the last three years, but what does the future have in store? You can see how its balance sheet has strengthened (or weakened) over time in this free interactive graphic.
What About Dividends?
It is important to consider the total shareholder return, as well as the share price return, for any given stock. The TSR is a return calculation that accounts for the value of cash dividends (assuming that any dividend received was reinvested) and the calculated value of any discounted capital raisings and spin-offs. It's fair to say that the TSR gives a more complete picture for stocks that pay a dividend. In the case of King Slide Works, it has a TSR of 343% for the last 5 years. That exceeds its share price return that we previously mentioned. And there's no prize for guessing that the dividend payments largely explain the divergence!
A Different Perspective
It's nice to see that King Slide Works shareholders have received a total shareholder return of 64% over the last year. And that does include the dividend. That's better than the annualised return of 35% over half a decade, implying that the company is doing better recently. Given the share price momentum remains strong, it might be worth taking a closer look at the stock, lest you miss an opportunity. It's always interesting to track share price performance over the longer term. But to understand King Slide Works better, we need to consider many other factors. Consider for instance, the ever-present spectre of investment risk. We've identified 2 warning signs with King Slide Works (at least 1 which is potentially serious) , and understanding them should be part of your investment process.
We will like King Slide Works better if we see some big insider buys. While we wait, check out this free list of undervalued stocks (mostly small caps) with considerable, recent, insider buying.
Please note, the market returns quoted in this article reflect the market weighted average returns of stocks that currently trade on Taiwanese exchanges.
Valuation is complex, but we're here to simplify it.
Discover if King Slide Works might be undervalued or overvalued with our detailed analysis, featuring fair value estimates, potential risks, dividends, insider trades, and its financial condition.
Access Free AnalysisHave feedback on this article? Concerned about the content? Get in touch with us directly. Alternatively, email editorial-team (at) simplywallst.com.
This article by Simply Wall St is general in nature. We provide commentary based on historical data and analyst forecasts only using an unbiased methodology and our articles are not intended to be financial advice. It does not constitute a recommendation to buy or sell any stock, and does not take account of your objectives, or your financial situation. We aim to bring you long-term focused analysis driven by fundamental data. Note that our analysis may not factor in the latest price-sensitive company announcements or qualitative material. Simply Wall St has no position in any stocks mentioned.
Have feedback on this article? Concerned about the content? Get in touch with us directly. Alternatively, email editorial-team@simplywallst.com
About TWSE:2059
King Slide Works
Engages in the research and development, design, and sale of rail kits for servers and network communication equipment in Taiwan.
Solid track record with excellent balance sheet.
