- Taiwan
- /
- Electronic Equipment and Components
- /
- TPEX:8042
Reflecting on Taiwan Chinsan Electronic Industrial's (GTSM:8042) Share Price Returns Over The Last Three Years
While not a mind-blowing move, it is good to see that the Taiwan Chinsan Electronic Industrial Co., Ltd. (GTSM:8042) share price has gained 18% in the last three months. But that cannot eclipse the less-than-impressive returns over the last three years. After all, the share price is down 30% in the last three years, significantly under-performing the market.
See our latest analysis for Taiwan Chinsan Electronic Industrial
To quote Buffett, 'Ships will sail around the world but the Flat Earth Society will flourish. There will continue to be wide discrepancies between price and value in the marketplace...' One way to examine how market sentiment has changed over time is to look at the interaction between a company's share price and its earnings per share (EPS).
Taiwan Chinsan Electronic Industrial became profitable within the last five years. That would generally be considered a positive, so we are surprised to see the share price is down. So it's worth looking at other metrics to try to understand the share price move.
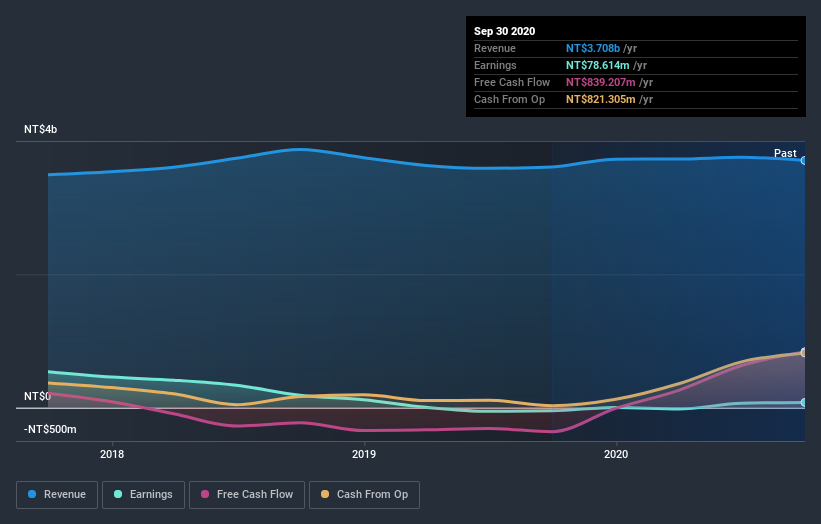
The company has kept revenue pretty healthy over the last three years, so we doubt that explains the falling share price. There doesn't seem to be any clear correlation between the fundamental business metrics and the share price. That could mean that the stock was previously overrated, or it could spell opportunity now.
You can see how earnings and revenue have changed over time in the image below (click on the chart to see the exact values).

Take a more thorough look at Taiwan Chinsan Electronic Industrial's financial health with this free report on its balance sheet.
What about the Total Shareholder Return (TSR)?
Investors should note that there's a difference between Taiwan Chinsan Electronic Industrial's total shareholder return (TSR) and its share price change, which we've covered above. Arguably the TSR is a more complete return calculation because it accounts for the value of dividends (as if they were reinvested), along with the hypothetical value of any discounted capital that have been offered to shareholders. Its history of dividend payouts mean that Taiwan Chinsan Electronic Industrial's TSR, which was a 22% drop over the last 3 years, was not as bad as the share price return.
A Different Perspective
Taiwan Chinsan Electronic Industrial shareholders have received returns of 22% over twelve months, which isn't far from the general market return. Most would be happy with a gain, and it helps that the year's return is actually better than the average return over five years, which was 9%. Even if the share price growth slows down from here, there's a good chance that this is business worth watching in the long term. It's always interesting to track share price performance over the longer term. But to understand Taiwan Chinsan Electronic Industrial better, we need to consider many other factors. Consider for instance, the ever-present spectre of investment risk. We've identified 2 warning signs with Taiwan Chinsan Electronic Industrial (at least 1 which can't be ignored) , and understanding them should be part of your investment process.
If you are like me, then you will not want to miss this free list of growing companies that insiders are buying.
Please note, the market returns quoted in this article reflect the market weighted average returns of stocks that currently trade on TW exchanges.
When trading Taiwan Chinsan Electronic Industrial or any other investment, use the platform considered by many to be the Professional's Gateway to the Worlds Market, Interactive Brokers. You get the lowest-cost* trading on stocks, options, futures, forex, bonds and funds worldwide from a single integrated account. Promoted
Valuation is complex, but we're here to simplify it.
Discover if Taiwan Chinsan Electronic Industrial might be undervalued or overvalued with our detailed analysis, featuring fair value estimates, potential risks, dividends, insider trades, and its financial condition.
Access Free AnalysisThis article by Simply Wall St is general in nature. It does not constitute a recommendation to buy or sell any stock, and does not take account of your objectives, or your financial situation. We aim to bring you long-term focused analysis driven by fundamental data. Note that our analysis may not factor in the latest price-sensitive company announcements or qualitative material. Simply Wall St has no position in any stocks mentioned.
*Interactive Brokers Rated Lowest Cost Broker by StockBrokers.com Annual Online Review 2020
Have feedback on this article? Concerned about the content? Get in touch with us directly. Alternatively, email editorial-team@simplywallst.com.
About TPEX:8042
Taiwan Chinsan Electronic Industrial
Taiwan Chinsan Electronic Industrial Co., Ltd.
Adequate balance sheet with slight risk.
Similar Companies
Market Insights
Community Narratives


