
Advertisement
Are Strong Financial Prospects The Force That Is Driving The Momentum In SYSAGE Technology Co., Ltd.'s TPE:6112) Stock?
SYSAGE Technology's (TPE:6112) stock is up by a considerable 12% over the past three months. Given that the market rewards strong financials in the long-term, we wonder if that is the case in this instance. In this article, we decided to focus on SYSAGE Technology's ROE.
Return on equity or ROE is a key measure used to assess how efficiently a company's management is utilizing the company's capital. Put another way, it reveals the company's success at turning shareholder investments into profits.
See our latest analysis for SYSAGE Technology
How To Calculate Return On Equity?
ROE can be calculated by using the formula:
Return on Equity = Net Profit (from continuing operations) ÷ Shareholders' Equity
So, based on the above formula, the ROE for SYSAGE Technology is:
12% = NT$534m ÷ NT$4.4b (Based on the trailing twelve months to September 2020).
The 'return' refers to a company's earnings over the last year. One way to conceptualize this is that for each NT$1 of shareholders' capital it has, the company made NT$0.12 in profit.
What Is The Relationship Between ROE And Earnings Growth?
We have already established that ROE serves as an efficient profit-generating gauge for a company's future earnings. We now need to evaluate how much profit the company reinvests or "retains" for future growth which then gives us an idea about the growth potential of the company. Assuming all else is equal, companies that have both a higher return on equity and higher profit retention are usually the ones that have a higher growth rate when compared to companies that don't have the same features.
SYSAGE Technology's Earnings Growth And 12% ROE
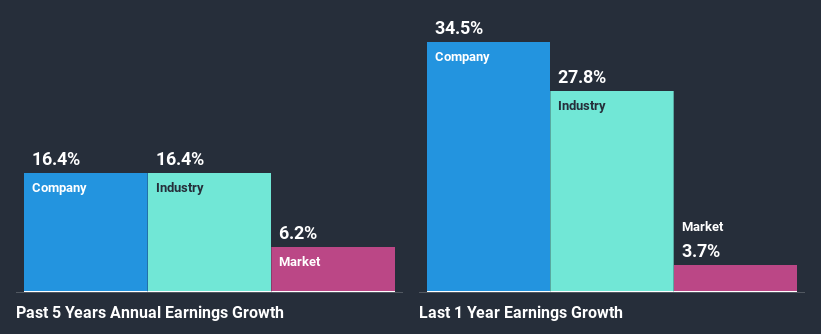
At first glance, SYSAGE Technology seems to have a decent ROE. Further, the company's ROE is similar to the industry average of 14%. This certainly adds some context to SYSAGE Technology's moderate 16% net income growth seen over the past five years.
Next, on comparing SYSAGE Technology's net income growth with the industry, we found that the company's reported growth is similar to the industry average growth rate of 16% in the same period.
Earnings growth is an important metric to consider when valuing a stock. The investor should try to establish if the expected growth or decline in earnings, whichever the case may be, is priced in. By doing so, they will have an idea if the stock is headed into clear blue waters or if swampy waters await. Is 6112 fairly valued? This infographic on the company's intrinsic value has everything you need to know.
Is SYSAGE Technology Making Efficient Use Of Its Profits?
SYSAGE Technology has a significant three-year median payout ratio of 54%, meaning that it is left with only 46% to reinvest into its business. This implies that the company has been able to achieve decent earnings growth despite returning most of its profits to shareholders.
Moreover, SYSAGE Technology is determined to keep sharing its profits with shareholders which we infer from its long history of eight years of paying a dividend.
Summary
Overall, we are quite pleased with SYSAGE Technology's performance. In particular, its high ROE is quite noteworthy and also the probable explanation behind its considerable earnings growth. Yet, the company is retaining a small portion of its profits. Which means that the company has been able to grow its earnings in spite of it, so that's not too bad. On studying current analyst estimates, we found that analysts expect the company to continue its recent growth streak. Are these analysts expectations based on the broad expectations for the industry, or on the company's fundamentals? Click here to be taken to our analyst's forecasts page for the company.
If you decide to trade SYSAGE Technology, use the lowest-cost* platform that is rated #1 Overall by Barron’s, Interactive Brokers. Trade stocks, options, futures, forex, bonds and funds on 135 markets, all from a single integrated account. Promoted
New: Manage All Your Stock Portfolios in One Place
We've created the ultimate portfolio companion for stock investors, and it's free.
• Connect an unlimited number of Portfolios and see your total in one currency
• Be alerted to new Warning Signs or Risks via email or mobile
• Track the Fair Value of your stocks
This article by Simply Wall St is general in nature. It does not constitute a recommendation to buy or sell any stock, and does not take account of your objectives, or your financial situation. We aim to bring you long-term focused analysis driven by fundamental data. Note that our analysis may not factor in the latest price-sensitive company announcements or qualitative material. Simply Wall St has no position in any stocks mentioned.
*Interactive Brokers Rated Lowest Cost Broker by StockBrokers.com Annual Online Review 2020
Have feedback on this article? Concerned about the content? Get in touch with us directly. Alternatively, email editorial-team@simplywallst.com.
About TWSE:6112
Metaage
Distributes and resells software and hardware equipment of ICT infrastructures in Taiwan, the United States of America, Africa, and internationally.
Adequate balance sheet with low risk.
Similar Companies
Market Insights

Advertisement
Community Narratives
MicroVision will explode future revenue by 380.37% with a vision towards success
Fair Value US$60.00|98.4% undervalued
TH
Community Contributor
The Indispensable Artery for a New North American Economy
Fair Value CA$132.87|1.3% undervalued
TI
Community Contributor