
Advertisement
- Taiwan
- /
- Semiconductors
- /
- TWSE:8104
Is RiTdisplay Corporation's (TPE:8104) Stock Price Struggling As A Result Of Its Mixed Financials?
It is hard to get excited after looking at RiTdisplay's (TPE:8104) recent performance, when its stock has declined 5.2% over the past three months. It is possible that the markets have ignored the company's differing financials and decided to lean-in to the negative sentiment. Fundamentals usually dictate market outcomes so it makes sense to study the company's financials. Particularly, we will be paying attention to RiTdisplay's ROE today.
ROE or return on equity is a useful tool to assess how effectively a company can generate returns on the investment it received from its shareholders. Put another way, it reveals the company's success at turning shareholder investments into profits.
Check out our latest analysis for RiTdisplay
How Is ROE Calculated?
Return on equity can be calculated by using the formula:
Return on Equity = Net Profit (from continuing operations) ÷ Shareholders' Equity
So, based on the above formula, the ROE for RiTdisplay is:
6.7% = NT$133m ÷ NT$2.0b (Based on the trailing twelve months to September 2020).
The 'return' is the income the business earned over the last year. That means that for every NT$1 worth of shareholders' equity, the company generated NT$0.07 in profit.
What Is The Relationship Between ROE And Earnings Growth?
Thus far, we have learned that ROE measures how efficiently a company is generating its profits. Based on how much of its profits the company chooses to reinvest or "retain", we are then able to evaluate a company's future ability to generate profits. Assuming everything else remains unchanged, the higher the ROE and profit retention, the higher the growth rate of a company compared to companies that don't necessarily bear these characteristics.
RiTdisplay's Earnings Growth And 6.7% ROE
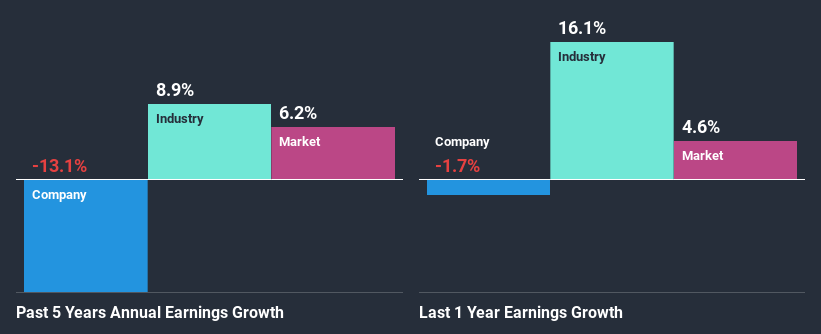
At first glance, RiTdisplay's ROE doesn't look very promising. We then compared the company's ROE to the broader industry and were disappointed to see that the ROE is lower than the industry average of 12%. Given the circumstances, the significant decline in net income by 13% seen by RiTdisplay over the last five years is not surprising. However, there could also be other factors causing the earnings to decline. For example, it is possible that the business has allocated capital poorly or that the company has a very high payout ratio.
That being said, we compared RiTdisplay's performance with the industry and were concerned when we found that while the company has shrunk its earnings, the industry has grown its earnings at a rate of 8.9% in the same period.
Earnings growth is a huge factor in stock valuation. The investor should try to establish if the expected growth or decline in earnings, whichever the case may be, is priced in. Doing so will help them establish if the stock's future looks promising or ominous. Is RiTdisplay fairly valued compared to other companies? These 3 valuation measures might help you decide.
Is RiTdisplay Efficiently Re-investing Its Profits?
Looking at its three-year median payout ratio of 30% (or a retention ratio of 70%) which is pretty normal, RiTdisplay's declining earnings is rather baffling as one would expect to see a fair bit of growth when a company is retaining a good portion of its profits. So there might be other factors at play here which could potentially be hampering growth. For example, the business has faced some headwinds.
Additionally, RiTdisplay has paid dividends over a period of four years, which means that the company's management is rather focused on keeping up its dividend payments, regardless of the shrinking earnings.
Conclusion
Overall, we have mixed feelings about RiTdisplay. Even though it appears to be retaining most of its profits, given the low ROE, investors may not be benefitting from all that reinvestment after all. The low earnings growth suggests our theory correct. Wrapping up, we would proceed with caution with this company and one way of doing that would be to look at the risk profile of the business. You can see the 2 risks we have identified for RiTdisplay by visiting our risks dashboard for free on our platform here.
When trading RiTdisplay or any other investment, use the platform considered by many to be the Professional's Gateway to the Worlds Market, Interactive Brokers. You get the lowest-cost* trading on stocks, options, futures, forex, bonds and funds worldwide from a single integrated account. Promoted
New: AI Stock Screener & Alerts
Our new AI Stock Screener scans the market every day to uncover opportunities.
• Dividend Powerhouses (3%+ Yield)
• Undervalued Small Caps with Insider Buying
• High growth Tech and AI Companies
Or build your own from over 50 metrics.
This article by Simply Wall St is general in nature. It does not constitute a recommendation to buy or sell any stock, and does not take account of your objectives, or your financial situation. We aim to bring you long-term focused analysis driven by fundamental data. Note that our analysis may not factor in the latest price-sensitive company announcements or qualitative material. Simply Wall St has no position in any stocks mentioned.
*Interactive Brokers Rated Lowest Cost Broker by StockBrokers.com Annual Online Review 2020
Have feedback on this article? Concerned about the content? Get in touch with us directly. Alternatively, email editorial-team (at) simplywallst.com.
About TWSE:8104
RiTdisplay
Engages in the research, development, and manufacturing of PMOLED products in Taiwan and internationally.
Slight risk and fair value.
Similar Companies
Market Insights

Advertisement
Community Narratives
The company that turned a verb into a global necessity and basically runs the modern internet, digital ads, smartphones, maps, and AI.
Fair Value US$300.00|5.1% undervalued
OS
Community Contributor
Flowers Foods Pays A Fair Price For Health
Fair Value US$16.12|27.7% undervalued
NV
Community Contributor
TMX Group will thrive with 33.3% profit margin and enduring market moat
Fair Value CA$49.90|0.2% overvalued
LI
Community Contributor
The "Molecular Pencil": Why Beam's Technology is Built to Win
Fair Value US$65.01|64.4% undervalued
DA
Community Contributor