Stock Analysis
- Taiwan
- /
- Semiconductors
- /
- TWSE:5269
Did You Participate In Any Of ASMedia Technology's (TPE:5269) Incredible 870% Return?


For many, the main point of investing in the stock market is to achieve spectacular returns. And we've seen some truly amazing gains over the years. Just think about the savvy investors who held ASMedia Technology Inc. (TPE:5269) shares for the last five years, while they gained 804%. If that doesn't get you thinking about long term investing, we don't know what will. Also pleasing for shareholders was the 15% gain in the last three months. But this could be related to the strong market, which is up 12% in the last three months.
It really delights us to see such great share price performance for investors.
View our latest analysis for ASMedia Technology
In his essay The Superinvestors of Graham-and-Doddsville Warren Buffett described how share prices do not always rationally reflect the value of a business. By comparing earnings per share (EPS) and share price changes over time, we can get a feel for how investor attitudes to a company have morphed over time.
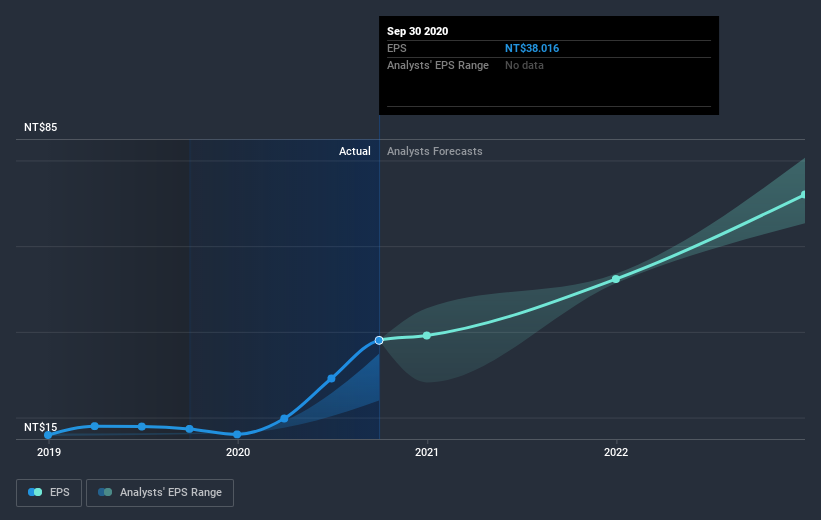
Over half a decade, ASMedia Technology managed to grow its earnings per share at 64% a year. This EPS growth is reasonably close to the 55% average annual increase in the share price. Therefore one could conclude that sentiment towards the shares hasn't morphed very much. Indeed, it would appear the share price is reacting to the EPS.
The graphic below depicts how EPS has changed over time (unveil the exact values by clicking on the image).
It is of course excellent to see how ASMedia Technology has grown profits over the years, but the future is more important for shareholders. If you are thinking of buying or selling ASMedia Technology stock, you should check out this FREE detailed report on its balance sheet.
What About Dividends?
It is important to consider the total shareholder return, as well as the share price return, for any given stock. The TSR is a return calculation that accounts for the value of cash dividends (assuming that any dividend received was reinvested) and the calculated value of any discounted capital raisings and spin-offs. It's fair to say that the TSR gives a more complete picture for stocks that pay a dividend. We note that for ASMedia Technology the TSR over the last 5 years was 870%, which is better than the share price return mentioned above. The dividends paid by the company have thusly boosted the total shareholder return.
A Different Perspective
It's nice to see that ASMedia Technology shareholders have received a total shareholder return of 183% over the last year. That's including the dividend. Since the one-year TSR is better than the five-year TSR (the latter coming in at 58% per year), it would seem that the stock's performance has improved in recent times. Given the share price momentum remains strong, it might be worth taking a closer look at the stock, lest you miss an opportunity. While it is well worth considering the different impacts that market conditions can have on the share price, there are other factors that are even more important. Take risks, for example - ASMedia Technology has 2 warning signs (and 1 which is significant) we think you should know about.
If you would prefer to check out another company -- one with potentially superior financials -- then do not miss this free list of companies that have proven they can grow earnings.
Please note, the market returns quoted in this article reflect the market weighted average returns of stocks that currently trade on TW exchanges.
When trading ASMedia Technology or any other investment, use the platform considered by many to be the Professional's Gateway to the Worlds Market, Interactive Brokers. You get the lowest-cost* trading on stocks, options, futures, forex, bonds and funds worldwide from a single integrated account. Promoted
Valuation is complex, but we're helping make it simple.
Find out whether ASMedia Technology is potentially over or undervalued by checking out our comprehensive analysis, which includes fair value estimates, risks and warnings, dividends, insider transactions and financial health.
View the Free AnalysisThis article by Simply Wall St is general in nature. It does not constitute a recommendation to buy or sell any stock, and does not take account of your objectives, or your financial situation. We aim to bring you long-term focused analysis driven by fundamental data. Note that our analysis may not factor in the latest price-sensitive company announcements or qualitative material. Simply Wall St has no position in any stocks mentioned.
*Interactive Brokers Rated Lowest Cost Broker by StockBrokers.com Annual Online Review 2020
Have feedback on this article? Concerned about the content? Get in touch with us directly. Alternatively, email editorial-team@simplywallst.com.
About TWSE:5269
ASMedia Technology
A fabless IC design company, engages in the design, development, production, manufacture, and sale of high-speed analogue circuit products in the United States, Taiwan, China, Southeast Asia, Northeast Asia, and internationally.
Exceptional growth potential with excellent balance sheet.
