- Taiwan
- /
- Specialty Stores
- /
- TWSE:2430
Does Tsann Kuen Enterprise Co.,Ltd's (TPE:2430) Weak Fundamentals Mean That The Market Could Correct Its Share Price?
Tsann Kuen EnterpriseLtd (TPE:2430) has had a great run on the share market with its stock up by a significant 28% over the last three months. However, we decided to pay close attention to its weak financials as we are doubtful that the current momentum will keep up, given the scenario. Particularly, we will be paying attention to Tsann Kuen EnterpriseLtd's ROE today.
Return on equity or ROE is a key measure used to assess how efficiently a company's management is utilizing the company's capital. In simpler terms, it measures the profitability of a company in relation to shareholder's equity.
Check out our latest analysis for Tsann Kuen EnterpriseLtd
How Do You Calculate Return On Equity?
Return on equity can be calculated by using the formula:
Return on Equity = Net Profit (from continuing operations) ÷ Shareholders' Equity
So, based on the above formula, the ROE for Tsann Kuen EnterpriseLtd is:
6.4% = NT$308m ÷ NT$4.8b (Based on the trailing twelve months to December 2020).
The 'return' is the yearly profit. That means that for every NT$1 worth of shareholders' equity, the company generated NT$0.06 in profit.
Why Is ROE Important For Earnings Growth?
So far, we've learned that ROE is a measure of a company's profitability. Based on how much of its profits the company chooses to reinvest or "retain", we are then able to evaluate a company's future ability to generate profits. Assuming everything else remains unchanged, the higher the ROE and profit retention, the higher the growth rate of a company compared to companies that don't necessarily bear these characteristics.
A Side By Side comparison of Tsann Kuen EnterpriseLtd's Earnings Growth And 6.4% ROE
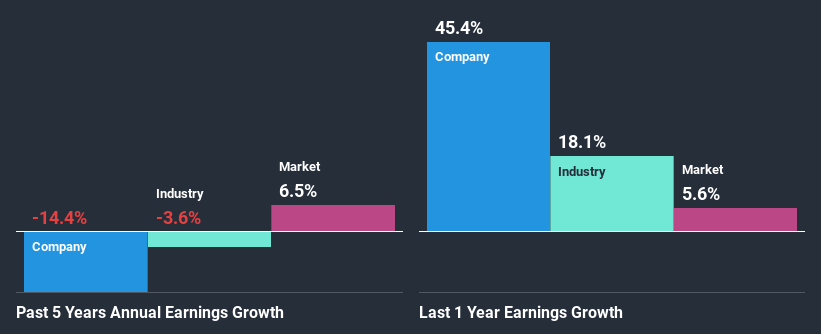
When you first look at it, Tsann Kuen EnterpriseLtd's ROE doesn't look that attractive. Next, when compared to the average industry ROE of 13%, the company's ROE leaves us feeling even less enthusiastic. Given the circumstances, the significant decline in net income by 14% seen by Tsann Kuen EnterpriseLtd over the last five years is not surprising. However, there could also be other factors causing the earnings to decline. For example, it is possible that the business has allocated capital poorly or that the company has a very high payout ratio.
Furthermore, even when compared to the industry, which has been shrinking its earnings at a rate 3.6% in the same period, we found that Tsann Kuen EnterpriseLtd's performance is pretty disappointing, as it suggests that the company has been shrunk its earnings at a rate faster than the industry.

Earnings growth is a huge factor in stock valuation. It’s important for an investor to know whether the market has priced in the company's expected earnings growth (or decline). By doing so, they will have an idea if the stock is headed into clear blue waters or if swampy waters await. If you're wondering about Tsann Kuen EnterpriseLtd's's valuation, check out this gauge of its price-to-earnings ratio, as compared to its industry.
Is Tsann Kuen EnterpriseLtd Using Its Retained Earnings Effectively?
With a high three-year median payout ratio of 76% (implying that 24% of the profits are retained), most of Tsann Kuen EnterpriseLtd's profits are being paid to shareholders, which explains the company's shrinking earnings. With only a little being reinvested into the business, earnings growth would obviously be low or non-existent. Our risks dashboard should have the 2 risks we have identified for Tsann Kuen EnterpriseLtd.
Moreover, Tsann Kuen EnterpriseLtd has been paying dividends for at least ten years or more suggesting that management must have perceived that the shareholders prefer dividends over earnings growth.
Summary
In total, we would have a hard think before deciding on any investment action concerning Tsann Kuen EnterpriseLtd. As a result of its low ROE and lack of mich reinvestment into the business, the company has seen a disappointing earnings growth rate. Up till now, we've only made a short study of the company's growth data. You can do your own research on Tsann Kuen EnterpriseLtd and see how it has performed in the past by looking at this FREE detailed graph of past earnings, revenue and cash flows.
When trading Tsann Kuen EnterpriseLtd or any other investment, use the platform considered by many to be the Professional's Gateway to the Worlds Market, Interactive Brokers. You get the lowest-cost* trading on stocks, options, futures, forex, bonds and funds worldwide from a single integrated account. Promoted
Valuation is complex, but we're here to simplify it.
Discover if Tsann Kuen EnterpriseLtd might be undervalued or overvalued with our detailed analysis, featuring fair value estimates, potential risks, dividends, insider trades, and its financial condition.
Access Free AnalysisThis article by Simply Wall St is general in nature. It does not constitute a recommendation to buy or sell any stock, and does not take account of your objectives, or your financial situation. We aim to bring you long-term focused analysis driven by fundamental data. Note that our analysis may not factor in the latest price-sensitive company announcements or qualitative material. Simply Wall St has no position in any stocks mentioned.
*Interactive Brokers Rated Lowest Cost Broker by StockBrokers.com Annual Online Review 2020
Have feedback on this article? Concerned about the content? Get in touch with us directly. Alternatively, email editorial-team (at) simplywallst.com.
About TWSE:2430
Tsann Kuen EnterpriseLtd
Through its subsidiaries, engages in the trading of various 3C department stores.
Adequate balance sheet average dividend payer.
Similar Companies
Market Insights
Community Narratives


