
Advertisement
- Taiwan
- /
- Real Estate
- /
- TWSE:5531
Shining Building BusinessLtd (TPE:5531) Has A Somewhat Strained Balance Sheet
Howard Marks put it nicely when he said that, rather than worrying about share price volatility, 'The possibility of permanent loss is the risk I worry about... and every practical investor I know worries about.' So it might be obvious that you need to consider debt, when you think about how risky any given stock is, because too much debt can sink a company. We note that Shining Building Business Co.,Ltd. (TPE:5531) does have debt on its balance sheet. But the real question is whether this debt is making the company risky.
What Risk Does Debt Bring?
Debt and other liabilities become risky for a business when it cannot easily fulfill those obligations, either with free cash flow or by raising capital at an attractive price. Ultimately, if the company can't fulfill its legal obligations to repay debt, shareholders could walk away with nothing. However, a more frequent (but still costly) occurrence is where a company must issue shares at bargain-basement prices, permanently diluting shareholders, just to shore up its balance sheet. Having said that, the most common situation is where a company manages its debt reasonably well - and to its own advantage. When we examine debt levels, we first consider both cash and debt levels, together.
See our latest analysis for Shining Building BusinessLtd
What Is Shining Building BusinessLtd's Net Debt?
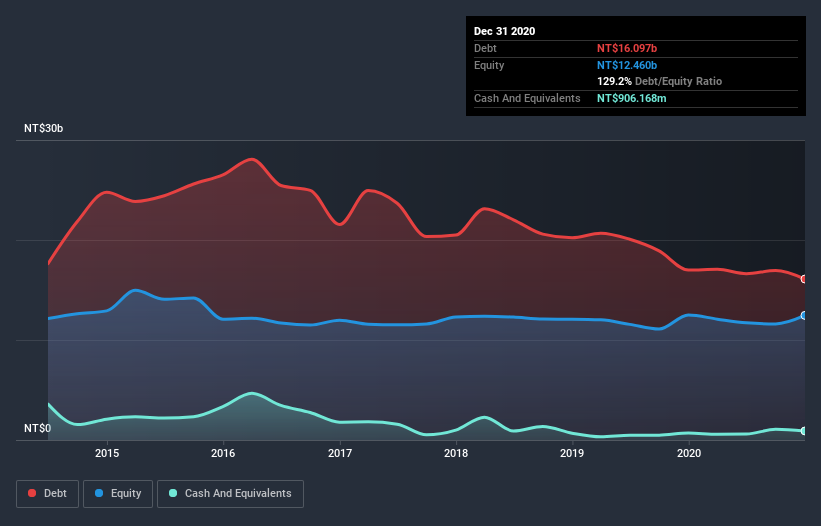
As you can see below, Shining Building BusinessLtd had NT$16.1b of debt at December 2020, down from NT$17.0b a year prior. However, it does have NT$906.2m in cash offsetting this, leading to net debt of about NT$15.2b.
How Strong Is Shining Building BusinessLtd's Balance Sheet?
According to the last reported balance sheet, Shining Building BusinessLtd had liabilities of NT$11.3b due within 12 months, and liabilities of NT$8.16b due beyond 12 months. On the other hand, it had cash of NT$906.2m and NT$843.3m worth of receivables due within a year. So its liabilities total NT$17.7b more than the combination of its cash and short-term receivables.
Given this deficit is actually higher than the company's market capitalization of NT$14.7b, we think shareholders really should watch Shining Building BusinessLtd's debt levels, like a parent watching their child ride a bike for the first time. In the scenario where the company had to clean up its balance sheet quickly, it seems likely shareholders would suffer extensive dilution.
We use two main ratios to inform us about debt levels relative to earnings. The first is net debt divided by earnings before interest, tax, depreciation, and amortization (EBITDA), while the second is how many times its earnings before interest and tax (EBIT) covers its interest expense (or its interest cover, for short). The advantage of this approach is that we take into account both the absolute quantum of debt (with net debt to EBITDA) and the actual interest expenses associated with that debt (with its interest cover ratio).
Shining Building BusinessLtd shareholders face the double whammy of a high net debt to EBITDA ratio (17.1), and fairly weak interest coverage, since EBIT is just 0.73 times the interest expense. This means we'd consider it to have a heavy debt load. Worse, Shining Building BusinessLtd's EBIT was down 74% over the last year. If earnings continue to follow that trajectory, paying off that debt load will be harder than convincing us to run a marathon in the rain. When analysing debt levels, the balance sheet is the obvious place to start. But you can't view debt in total isolation; since Shining Building BusinessLtd will need earnings to service that debt. So if you're keen to discover more about its earnings, it might be worth checking out this graph of its long term earnings trend.
Finally, while the tax-man may adore accounting profits, lenders only accept cold hard cash. So we always check how much of that EBIT is translated into free cash flow. Over the last three years, Shining Building BusinessLtd actually produced more free cash flow than EBIT. That sort of strong cash conversion gets us as excited as the crowd when the beat drops at a Daft Punk concert.
Our View
To be frank both Shining Building BusinessLtd's interest cover and its track record of (not) growing its EBIT make us rather uncomfortable with its debt levels. But at least it's pretty decent at converting EBIT to free cash flow; that's encouraging. We're quite clear that we consider Shining Building BusinessLtd to be really rather risky, as a result of its balance sheet health. For this reason we're pretty cautious about the stock, and we think shareholders should keep a close eye on its liquidity. When analysing debt levels, the balance sheet is the obvious place to start. However, not all investment risk resides within the balance sheet - far from it. Be aware that Shining Building BusinessLtd is showing 2 warning signs in our investment analysis , you should know about...
If, after all that, you're more interested in a fast growing company with a rock-solid balance sheet, then check out our list of net cash growth stocks without delay.
If you’re looking to trade Shining Building BusinessLtd, open an account with the lowest-cost* platform trusted by professionals, Interactive Brokers. Their clients from over 200 countries and territories trade stocks, options, futures, forex, bonds and funds worldwide from a single integrated account. Promoted
New: Manage All Your Stock Portfolios in One Place
We've created the ultimate portfolio companion for stock investors, and it's free.
• Connect an unlimited number of Portfolios and see your total in one currency
• Be alerted to new Warning Signs or Risks via email or mobile
• Track the Fair Value of your stocks
This article by Simply Wall St is general in nature. It does not constitute a recommendation to buy or sell any stock, and does not take account of your objectives, or your financial situation. We aim to bring you long-term focused analysis driven by fundamental data. Note that our analysis may not factor in the latest price-sensitive company announcements or qualitative material. Simply Wall St has no position in any stocks mentioned.
*Interactive Brokers Rated Lowest Cost Broker by StockBrokers.com Annual Online Review 2020
Have feedback on this article? Concerned about the content? Get in touch with us directly. Alternatively, email editorial-team (at) simplywallst.com.
About TWSE:5531
Shining Building BusinessLtd
Operates as a real estate development company in Taiwan and Mainland China.
Slightly overvalued with questionable track record.
Similar Companies
Market Insights

Advertisement
Community Narratives
MicroVision will explode future revenue by 380.37% with a vision towards success
Fair Value US$60.00|98.4% undervalued
TH
Community Contributor
The Indispensable Artery for a New North American Economy
Fair Value CA$132.87|1.3% undervalued
TI
Community Contributor