- Taiwan
- /
- Real Estate
- /
- TWSE:9946
The one-year decline in earnings for San Far Property TWSE:9946) isn't encouraging, but shareholders are still up 153% over that period


It's been a soft week for San Far Property Limited (TWSE:9946) shares, which are down 21%. Despite this, the stock is a strong performer over the last year, no doubt about that. Indeed, the share price is up an impressive 145% in that time. So it may be that the share price is simply cooling off after a strong rise. Only time will tell if there is still too much optimism currently reflected in the share price.
While this past week has detracted from the company's one-year return, let's look at the recent trends of the underlying business and see if the gains have been in alignment.
Check out our latest analysis for San Far Property
While the efficient markets hypothesis continues to be taught by some, it has been proven that markets are over-reactive dynamic systems, and investors are not always rational. One imperfect but simple way to consider how the market perception of a company has shifted is to compare the change in the earnings per share (EPS) with the share price movement.
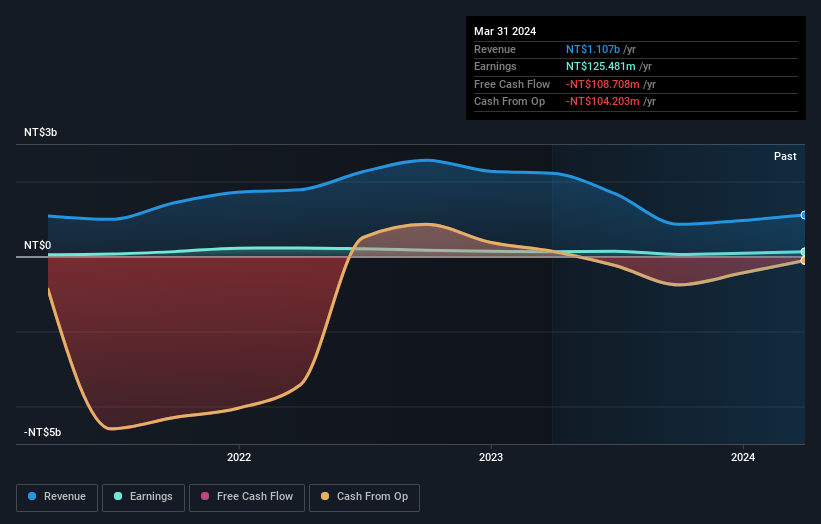
During the last year, San Far Property actually saw its earnings per share drop 1.8%.
We don't think that the decline in earnings per share is a good measure of the business over the last twelve months. Since the change in EPS doesn't seem to correlate with the change in share price, it's worth taking a look at other metrics.
We are skeptical of the suggestion that the 1.2% dividend yield would entice buyers to the stock. Unfortunately San Far Property's fell 50% over twelve months. So the fundamental metrics don't provide an obvious explanation for the share price gain.
The graphic below depicts how earnings and revenue have changed over time (unveil the exact values by clicking on the image).
Balance sheet strength is crucial. It might be well worthwhile taking a look at our free report on how its financial position has changed over time.
What About Dividends?
It is important to consider the total shareholder return, as well as the share price return, for any given stock. Whereas the share price return only reflects the change in the share price, the TSR includes the value of dividends (assuming they were reinvested) and the benefit of any discounted capital raising or spin-off. Arguably, the TSR gives a more comprehensive picture of the return generated by a stock. In the case of San Far Property, it has a TSR of 153% for the last 1 year. That exceeds its share price return that we previously mentioned. The dividends paid by the company have thusly boosted the total shareholder return.
A Different Perspective
It's good to see that San Far Property has rewarded shareholders with a total shareholder return of 153% in the last twelve months. That's including the dividend. That's better than the annualised return of 15% over half a decade, implying that the company is doing better recently. Given the share price momentum remains strong, it might be worth taking a closer look at the stock, lest you miss an opportunity. I find it very interesting to look at share price over the long term as a proxy for business performance. But to truly gain insight, we need to consider other information, too. Like risks, for instance. Every company has them, and we've spotted 3 warning signs for San Far Property (of which 2 are a bit concerning!) you should know about.
If you are like me, then you will not want to miss this free list of undervalued small caps that insiders are buying.
Please note, the market returns quoted in this article reflect the market weighted average returns of stocks that currently trade on Taiwanese exchanges.
New: Manage All Your Stock Portfolios in One Place
We've created the ultimate portfolio companion for stock investors, and it's free.
• Connect an unlimited number of Portfolios and see your total in one currency
• Be alerted to new Warning Signs or Risks via email or mobile
• Track the Fair Value of your stocks
Have feedback on this article? Concerned about the content? Get in touch with us directly. Alternatively, email editorial-team (at) simplywallst.com.
This article by Simply Wall St is general in nature. We provide commentary based on historical data and analyst forecasts only using an unbiased methodology and our articles are not intended to be financial advice. It does not constitute a recommendation to buy or sell any stock, and does not take account of your objectives, or your financial situation. We aim to bring you long-term focused analysis driven by fundamental data. Note that our analysis may not factor in the latest price-sensitive company announcements or qualitative material. Simply Wall St has no position in any stocks mentioned.
Have feedback on this article? Concerned about the content? Get in touch with us directly. Alternatively, email editorial-team@simplywallst.com
About TWSE:9946
San Far Property
Engages in the development and sale of residential and building properties in Taiwan.
Proven track record with mediocre balance sheet.

