- Taiwan
- /
- Real Estate
- /
- TWSE:2539
The total return for Sakura DevelopmentLtd (TWSE:2539) investors has risen faster than earnings growth over the last five years


Long term investing can be life changing when you buy and hold the truly great businesses. While the best companies are hard to find, but they can generate massive returns over long periods. Don't believe it? Then look at the Sakura Development Co.,Ltd (TWSE:2539) share price. It's 388% higher than it was five years ago. If that doesn't get you thinking about long term investing, we don't know what will. But it's down 3.8% in the last week.
While the stock has fallen 3.8% this week, it's worth focusing on the longer term and seeing if the stocks historical returns have been driven by the underlying fundamentals.
See our latest analysis for Sakura DevelopmentLtd
There is no denying that markets are sometimes efficient, but prices do not always reflect underlying business performance. By comparing earnings per share (EPS) and share price changes over time, we can get a feel for how investor attitudes to a company have morphed over time.
During five years of share price growth, Sakura DevelopmentLtd achieved compound earnings per share (EPS) growth of 23% per year. This EPS growth is slower than the share price growth of 37% per year, over the same period. So it's fair to assume the market has a higher opinion of the business than it did five years ago. That's not necessarily surprising considering the five-year track record of earnings growth.
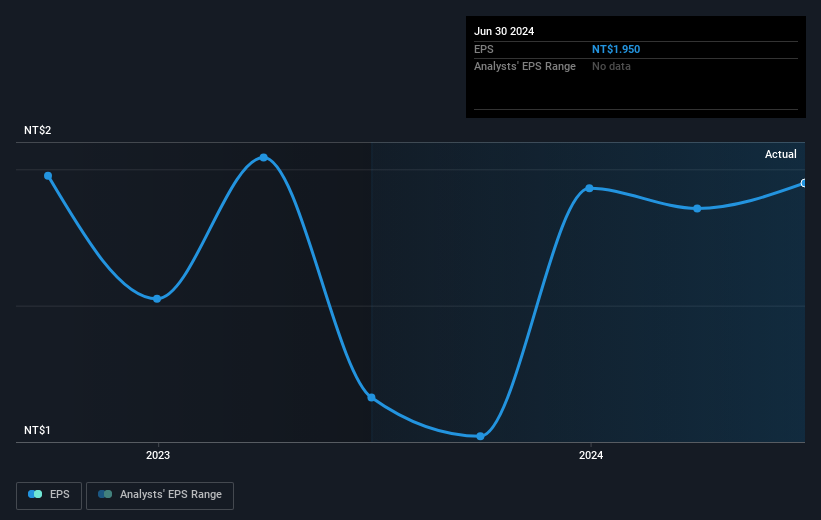
You can see below how EPS has changed over time (discover the exact values by clicking on the image).
Dive deeper into Sakura DevelopmentLtd's key metrics by checking this interactive graph of Sakura DevelopmentLtd's earnings, revenue and cash flow.
What About Dividends?
As well as measuring the share price return, investors should also consider the total shareholder return (TSR). The TSR incorporates the value of any spin-offs or discounted capital raisings, along with any dividends, based on the assumption that the dividends are reinvested. So for companies that pay a generous dividend, the TSR is often a lot higher than the share price return. In the case of Sakura DevelopmentLtd, it has a TSR of 412% for the last 5 years. That exceeds its share price return that we previously mentioned. And there's no prize for guessing that the dividend payments largely explain the divergence!
A Different Perspective
We're pleased to report that Sakura DevelopmentLtd shareholders have received a total shareholder return of 95% over one year. That's including the dividend. That's better than the annualised return of 39% over half a decade, implying that the company is doing better recently. In the best case scenario, this may hint at some real business momentum, implying that now could be a great time to delve deeper. While it is well worth considering the different impacts that market conditions can have on the share price, there are other factors that are even more important. For example, we've discovered 1 warning sign for Sakura DevelopmentLtd that you should be aware of before investing here.
We will like Sakura DevelopmentLtd better if we see some big insider buys. While we wait, check out this free list of undervalued stocks (mostly small caps) with considerable, recent, insider buying.
Please note, the market returns quoted in this article reflect the market weighted average returns of stocks that currently trade on Taiwanese exchanges.
New: Manage All Your Stock Portfolios in One Place
We've created the ultimate portfolio companion for stock investors, and it's free.
• Connect an unlimited number of Portfolios and see your total in one currency
• Be alerted to new Warning Signs or Risks via email or mobile
• Track the Fair Value of your stocks
Have feedback on this article? Concerned about the content? Get in touch with us directly. Alternatively, email editorial-team (at) simplywallst.com.
This article by Simply Wall St is general in nature. We provide commentary based on historical data and analyst forecasts only using an unbiased methodology and our articles are not intended to be financial advice. It does not constitute a recommendation to buy or sell any stock, and does not take account of your objectives, or your financial situation. We aim to bring you long-term focused analysis driven by fundamental data. Note that our analysis may not factor in the latest price-sensitive company announcements or qualitative material. Simply Wall St has no position in any stocks mentioned.
About TWSE:2539
Sakura DevelopmentLtd
Engages in the sale and lease of residential properties with focus on the Zhongzhangtou area in Taiwan.
Solid track record with adequate balance sheet.

