Stock Analysis

Most readers would already be aware that Nan Pao Resins Chemical's (TWSE:4766) stock increased significantly by 13% over the past three months. Given that the market rewards strong financials in the long-term, we wonder if that is the case in this instance. Specifically, we decided to study Nan Pao Resins Chemical's ROE in this article.
Return on equity or ROE is a key measure used to assess how efficiently a company's management is utilizing the company's capital. In other words, it is a profitability ratio which measures the rate of return on the capital provided by the company's shareholders.
Check out our latest analysis for Nan Pao Resins Chemical
How To Calculate Return On Equity?
ROE can be calculated by using the formula:
Return on Equity = Net Profit (from continuing operations) ÷ Shareholders' Equity
So, based on the above formula, the ROE for Nan Pao Resins Chemical is:
16% = NT$2.2b ÷ NT$14b (Based on the trailing twelve months to September 2023).
The 'return' is the profit over the last twelve months. Another way to think of that is that for every NT$1 worth of equity, the company was able to earn NT$0.16 in profit.
What Is The Relationship Between ROE And Earnings Growth?
Thus far, we have learned that ROE measures how efficiently a company is generating its profits. Depending on how much of these profits the company reinvests or "retains", and how effectively it does so, we are then able to assess a company’s earnings growth potential. Generally speaking, other things being equal, firms with a high return on equity and profit retention, have a higher growth rate than firms that don’t share these attributes.
Nan Pao Resins Chemical's Earnings Growth And 16% ROE
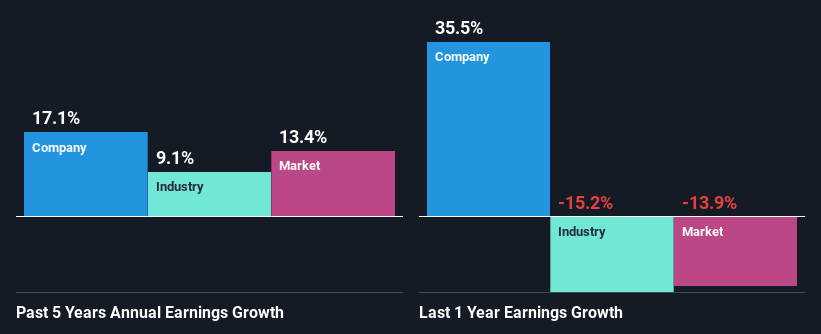
To begin with, Nan Pao Resins Chemical seems to have a respectable ROE. On comparing with the average industry ROE of 7.6% the company's ROE looks pretty remarkable. This probably laid the ground for Nan Pao Resins Chemical's moderate 17% net income growth seen over the past five years.
We then compared Nan Pao Resins Chemical's net income growth with the industry and we're pleased to see that the company's growth figure is higher when compared with the industry which has a growth rate of 9.1% in the same 5-year period.
Earnings growth is a huge factor in stock valuation. It’s important for an investor to know whether the market has priced in the company's expected earnings growth (or decline). By doing so, they will have an idea if the stock is headed into clear blue waters or if swampy waters await. Is Nan Pao Resins Chemical fairly valued compared to other companies? These 3 valuation measures might help you decide.
Is Nan Pao Resins Chemical Efficiently Re-investing Its Profits?
While Nan Pao Resins Chemical has a three-year median payout ratio of 65% (which means it retains 35% of profits), the company has still seen a fair bit of earnings growth in the past, meaning that its high payout ratio hasn't hampered its ability to grow.
Besides, Nan Pao Resins Chemical has been paying dividends over a period of six years. This shows that the company is committed to sharing profits with its shareholders.
Summary
In total, we are pretty happy with Nan Pao Resins Chemical's performance. In particular, its high ROE is quite noteworthy and also the probable explanation behind its considerable earnings growth. Yet, the company is retaining a small portion of its profits. Which means that the company has been able to grow its earnings in spite of it, so that's not too bad. Up till now, we've only made a short study of the company's growth data. You can do your own research on Nan Pao Resins Chemical and see how it has performed in the past by looking at this FREE detailed graph of past earnings, revenue and cash flows.
Valuation is complex, but we're helping make it simple.
Find out whether Nan Pao Resins Chemical is potentially over or undervalued by checking out our comprehensive analysis, which includes fair value estimates, risks and warnings, dividends, insider transactions and financial health.
View the Free AnalysisHave feedback on this article? Concerned about the content? Get in touch with us directly. Alternatively, email editorial-team (at) simplywallst.com.
This article by Simply Wall St is general in nature. We provide commentary based on historical data and analyst forecasts only using an unbiased methodology and our articles are not intended to be financial advice. It does not constitute a recommendation to buy or sell any stock, and does not take account of your objectives, or your financial situation. We aim to bring you long-term focused analysis driven by fundamental data. Note that our analysis may not factor in the latest price-sensitive company announcements or qualitative material. Simply Wall St has no position in any stocks mentioned.
About TWSE:4766
Nan Pao Resins Chemical
Nan Pao Resins Chemical Co., Ltd. engages in the manufacturing, wholesale, and retail sale of synthetic resins and plastics, adhesives, resin coatings, dyes, and pigments in Taiwan, Oceania, Asia, the United States, Africa, and Europe.
Flawless balance sheet with solid track record.

