Shiny Chemical Industrial's (TWSE:1773) five-year earnings growth trails the 28% YoY shareholder returns


When you buy shares in a company, it's worth keeping in mind the possibility that it could fail, and you could lose your money. But on a lighter note, a good company can see its share price rise well over 100%. For example, the Shiny Chemical Industrial Co., Ltd. (TWSE:1773) share price has soared 206% in the last half decade. Most would be very happy with that. And in the last week the share price has popped 5.3%. But this might be partly because the broader market had a good week last week, gaining 3.1%.
On the back of a solid 7-day performance, let's check what role the company's fundamentals have played in driving long term shareholder returns.
View our latest analysis for Shiny Chemical Industrial
To quote Buffett, 'Ships will sail around the world but the Flat Earth Society will flourish. There will continue to be wide discrepancies between price and value in the marketplace...' One flawed but reasonable way to assess how sentiment around a company has changed is to compare the earnings per share (EPS) with the share price.
Over half a decade, Shiny Chemical Industrial managed to grow its earnings per share at 14% a year. This EPS growth is slower than the share price growth of 25% per year, over the same period. So it's fair to assume the market has a higher opinion of the business than it did five years ago. And that's hardly shocking given the track record of growth.
You can see how EPS has changed over time in the image below (click on the chart to see the exact values).
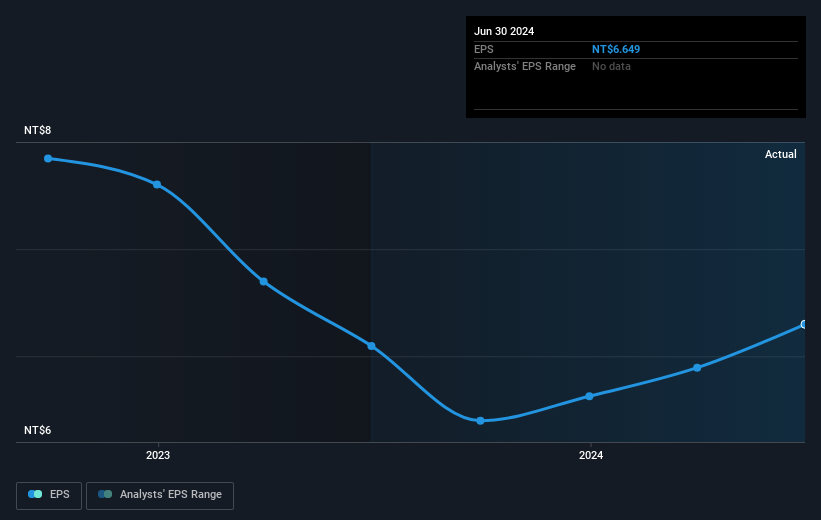
This free interactive report on Shiny Chemical Industrial's earnings, revenue and cash flow is a great place to start, if you want to investigate the stock further.
What About Dividends?
It is important to consider the total shareholder return, as well as the share price return, for any given stock. The TSR is a return calculation that accounts for the value of cash dividends (assuming that any dividend received was reinvested) and the calculated value of any discounted capital raisings and spin-offs. Arguably, the TSR gives a more comprehensive picture of the return generated by a stock. We note that for Shiny Chemical Industrial the TSR over the last 5 years was 240%, which is better than the share price return mentioned above. This is largely a result of its dividend payments!
A Different Perspective
Shiny Chemical Industrial provided a TSR of 17% over the last twelve months. But that was short of the market average. If we look back over five years, the returns are even better, coming in at 28% per year for five years. It's quite possible the business continues to execute with prowess, even as the share price gains are slowing. It's always interesting to track share price performance over the longer term. But to understand Shiny Chemical Industrial better, we need to consider many other factors. Even so, be aware that Shiny Chemical Industrial is showing 1 warning sign in our investment analysis , you should know about...
If you are like me, then you will not want to miss this free list of undervalued small caps that insiders are buying.
Please note, the market returns quoted in this article reflect the market weighted average returns of stocks that currently trade on Taiwanese exchanges.
New: Manage All Your Stock Portfolios in One Place
We've created the ultimate portfolio companion for stock investors, and it's free.
• Connect an unlimited number of Portfolios and see your total in one currency
• Be alerted to new Warning Signs or Risks via email or mobile
• Track the Fair Value of your stocks
Have feedback on this article? Concerned about the content? Get in touch with us directly. Alternatively, email editorial-team (at) simplywallst.com.
This article by Simply Wall St is general in nature. We provide commentary based on historical data and analyst forecasts only using an unbiased methodology and our articles are not intended to be financial advice. It does not constitute a recommendation to buy or sell any stock, and does not take account of your objectives, or your financial situation. We aim to bring you long-term focused analysis driven by fundamental data. Note that our analysis may not factor in the latest price-sensitive company announcements or qualitative material. Simply Wall St has no position in any stocks mentioned.
About TWSE:1773
Shiny Chemical Industrial
Manufactures, processes, and trades in chemical solvents in Taiwan.
Adequate balance sheet second-rate dividend payer.
