Despite the downward trend in earnings at Everlight Chemical Industrial (TWSE:1711) the stock spikes 11%, bringing five-year gains to 45%


The main point of investing for the long term is to make money. But more than that, you probably want to see it rise more than the market average. Unfortunately for shareholders, while the Everlight Chemical Industrial Corporation (TWSE:1711) share price is up 34% in the last five years, that's less than the market return. Zooming in, the stock is up just 4.3% in the last year.
On the back of a solid 7-day performance, let's check what role the company's fundamentals have played in driving long term shareholder returns.
View our latest analysis for Everlight Chemical Industrial
In his essay The Superinvestors of Graham-and-Doddsville Warren Buffett described how share prices do not always rationally reflect the value of a business. By comparing earnings per share (EPS) and share price changes over time, we can get a feel for how investor attitudes to a company have morphed over time.
During five years of share price growth, Everlight Chemical Industrial actually saw its EPS drop 28% per year.
This means it's unlikely the market is judging the company based on earnings growth. Since the change in EPS doesn't seem to correlate with the change in share price, it's worth taking a look at other metrics.
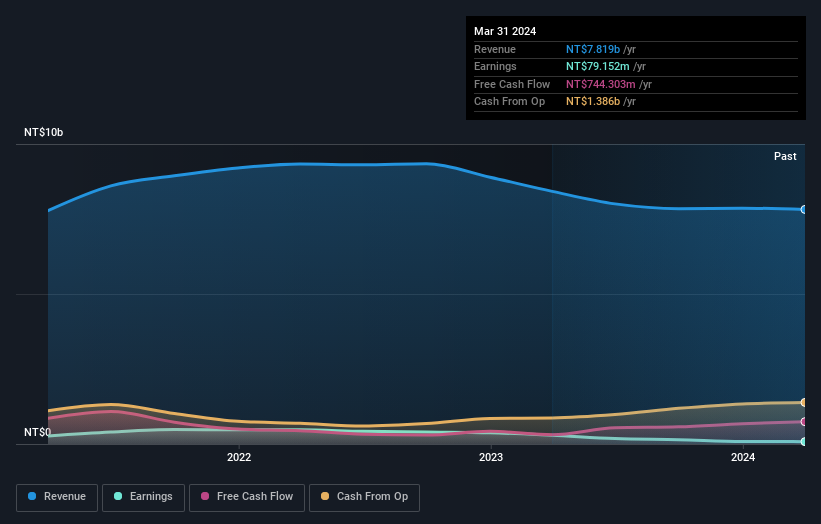
We doubt the modest 0.7% dividend yield is attracting many buyers to the stock. It is not great to see that revenue has dropped by 2.5% per year over five years. So it seems one might have to take closer look at earnings and revenue trends to see how they might influence the share price.
The graphic below depicts how earnings and revenue have changed over time (unveil the exact values by clicking on the image).
Balance sheet strength is crucial. It might be well worthwhile taking a look at our free report on how its financial position has changed over time.
What About Dividends?
When looking at investment returns, it is important to consider the difference between total shareholder return (TSR) and share price return. The TSR is a return calculation that accounts for the value of cash dividends (assuming that any dividend received was reinvested) and the calculated value of any discounted capital raisings and spin-offs. Arguably, the TSR gives a more comprehensive picture of the return generated by a stock. In the case of Everlight Chemical Industrial, it has a TSR of 45% for the last 5 years. That exceeds its share price return that we previously mentioned. And there's no prize for guessing that the dividend payments largely explain the divergence!
A Different Perspective
Everlight Chemical Industrial shareholders gained a total return of 5.1% during the year. But that was short of the market average. If we look back over five years, the returns are even better, coming in at 8% per year for five years. It may well be that this is a business worth popping on the watching, given the continuing positive reception, over time, from the market. While it is well worth considering the different impacts that market conditions can have on the share price, there are other factors that are even more important. Like risks, for instance. Every company has them, and we've spotted 2 warning signs for Everlight Chemical Industrial (of which 1 is a bit concerning!) you should know about.
We will like Everlight Chemical Industrial better if we see some big insider buys. While we wait, check out this free list of undervalued stocks (mostly small caps) with considerable, recent, insider buying.
Please note, the market returns quoted in this article reflect the market weighted average returns of stocks that currently trade on Taiwanese exchanges.
Valuation is complex, but we're here to simplify it.
Discover if Everlight Chemical Industrial might be undervalued or overvalued with our detailed analysis, featuring fair value estimates, potential risks, dividends, insider trades, and its financial condition.
Access Free AnalysisHave feedback on this article? Concerned about the content? Get in touch with us directly. Alternatively, email editorial-team (at) simplywallst.com.
This article by Simply Wall St is general in nature. We provide commentary based on historical data and analyst forecasts only using an unbiased methodology and our articles are not intended to be financial advice. It does not constitute a recommendation to buy or sell any stock, and does not take account of your objectives, or your financial situation. We aim to bring you long-term focused analysis driven by fundamental data. Note that our analysis may not factor in the latest price-sensitive company announcements or qualitative material. Simply Wall St has no position in any stocks mentioned.
Have feedback on this article? Concerned about the content? Get in touch with us directly. Alternatively, email editorial-team@simplywallst.com
About TWSE:1711
Everlight Chemical Industrial
Manufactures and sells chemical products in Taiwan, the United States, Asia, Europe, and internationally.
Flawless balance sheet with acceptable track record.

