- Taiwan
- /
- Consumer Durables
- /
- TWSE:9935
Despite the downward trend in earnings at Ching Feng Home FashionsLtd (TWSE:9935) the stock soars 10%, bringing one-year gains to 29%

There's no doubt that investing in the stock market is a truly brilliant way to build wealth. But not every stock you buy will perform as well as the overall market. Unfortunately for shareholders, while the Ching Feng Home Fashions Co.,Ltd (TWSE:9935) share price is up 25% in the last year, that falls short of the market return. Unfortunately the longer term returns are not so good, with the stock falling 15% in the last three years.
Since it's been a strong week for Ching Feng Home FashionsLtd shareholders, let's have a look at trend of the longer term fundamentals.
See our latest analysis for Ching Feng Home FashionsLtd
There is no denying that markets are sometimes efficient, but prices do not always reflect underlying business performance. One flawed but reasonable way to assess how sentiment around a company has changed is to compare the earnings per share (EPS) with the share price.
During the last year, Ching Feng Home FashionsLtd actually saw its earnings per share drop 53%.
So we don't think that investors are paying too much attention to EPS. Therefore, it seems likely that investors are putting more weight on metrics other than EPS, at the moment.
Unfortunately Ching Feng Home FashionsLtd's fell 14% over twelve months. So using a snapshot of key business metrics doesn't give us a good picture of why the market is bidding up the stock.
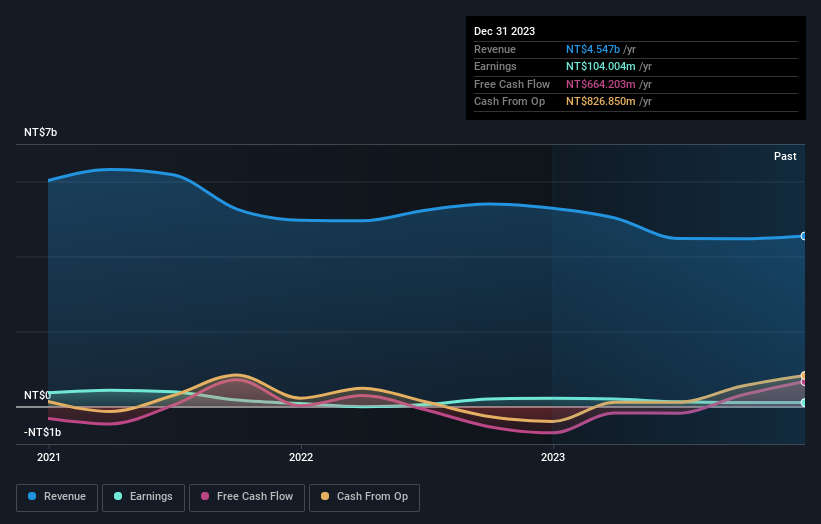
You can see how earnings and revenue have changed over time in the image below (click on the chart to see the exact values).
If you are thinking of buying or selling Ching Feng Home FashionsLtd stock, you should check out this FREE detailed report on its balance sheet.
What About Dividends?
When looking at investment returns, it is important to consider the difference between total shareholder return (TSR) and share price return. The TSR is a return calculation that accounts for the value of cash dividends (assuming that any dividend received was reinvested) and the calculated value of any discounted capital raisings and spin-offs. It's fair to say that the TSR gives a more complete picture for stocks that pay a dividend. We note that for Ching Feng Home FashionsLtd the TSR over the last 1 year was 29%, which is better than the share price return mentioned above. The dividends paid by the company have thusly boosted the total shareholder return.
A Different Perspective
Ching Feng Home FashionsLtd shareholders gained a total return of 29% during the year. Unfortunately this falls short of the market return. On the bright side, that's still a gain, and it's actually better than the average return of 3% over half a decade It is possible that returns will improve along with the business fundamentals. I find it very interesting to look at share price over the long term as a proxy for business performance. But to truly gain insight, we need to consider other information, too. Take risks, for example - Ching Feng Home FashionsLtd has 4 warning signs (and 2 which can't be ignored) we think you should know about.
Of course Ching Feng Home FashionsLtd may not be the best stock to buy. So you may wish to see this free collection of growth stocks.
Please note, the market returns quoted in this article reflect the market weighted average returns of stocks that currently trade on Taiwanese exchanges.
New: AI Stock Screener & Alerts
Our new AI Stock Screener scans the market every day to uncover opportunities.
• Dividend Powerhouses (3%+ Yield)
• Undervalued Small Caps with Insider Buying
• High growth Tech and AI Companies
Or build your own from over 50 metrics.
Have feedback on this article? Concerned about the content? Get in touch with us directly. Alternatively, email editorial-team (at) simplywallst.com.
This article by Simply Wall St is general in nature. We provide commentary based on historical data and analyst forecasts only using an unbiased methodology and our articles are not intended to be financial advice. It does not constitute a recommendation to buy or sell any stock, and does not take account of your objectives, or your financial situation. We aim to bring you long-term focused analysis driven by fundamental data. Note that our analysis may not factor in the latest price-sensitive company announcements or qualitative material. Simply Wall St has no position in any stocks mentioned.
About TWSE:9935
Ching Feng Home FashionsLtd
Engages in the design, development, manufacture, and sale of home decor products in Taiwan and internationally.
Proven track record with mediocre balance sheet.
