
Advertisement
What Do The Returns At Tex-Ray Industrial (TPE:1467) Mean Going Forward?
If you're looking for a multi-bagger, there's a few things to keep an eye out for. Typically, we'll want to notice a trend of growing return on capital employed (ROCE) and alongside that, an expanding base of capital employed. Ultimately, this demonstrates that it's a business that is reinvesting profits at increasing rates of return. With that in mind, we've noticed some promising trends at Tex-Ray Industrial (TPE:1467) so let's look a bit deeper.
Return On Capital Employed (ROCE): What is it?
For those who don't know, ROCE is a measure of a company's yearly pre-tax profit (its return), relative to the capital employed in the business. The formula for this calculation on Tex-Ray Industrial is:
Return on Capital Employed = Earnings Before Interest and Tax (EBIT) ÷ (Total Assets - Current Liabilities)
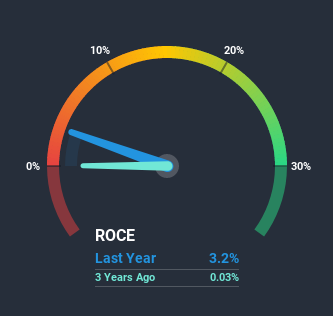
0.032 = NT$168m ÷ (NT$8.7b - NT$3.5b) (Based on the trailing twelve months to September 2020).
Thus, Tex-Ray Industrial has an ROCE of 3.2%. In absolute terms, that's a low return but it's around the Luxury industry average of 4.0%.
Check out our latest analysis for Tex-Ray Industrial
While the past is not representative of the future, it can be helpful to know how a company has performed historically, which is why we have this chart above. If you want to delve into the historical earnings, revenue and cash flow of Tex-Ray Industrial, check out these free graphs here.
So How Is Tex-Ray Industrial's ROCE Trending?
Even though ROCE is still low in absolute terms, it's good to see it's heading in the right direction. More specifically, while the company has kept capital employed relatively flat over the last five years, the ROCE has climbed 49% in that same time. So our take on this is that the business has increased efficiencies to generate these higher returns, all the while not needing to make any additional investments. The company is doing well in that sense, and it's worth investigating what the management team has planned for long term growth prospects.
On a separate but related note, it's important to know that Tex-Ray Industrial has a current liabilities to total assets ratio of 40%, which we'd consider pretty high. This effectively means that suppliers (or short-term creditors) are funding a large portion of the business, so just be aware that this can introduce some elements of risk. While it's not necessarily a bad thing, it can be beneficial if this ratio is lower.
Our Take On Tex-Ray Industrial's ROCE
As discussed above, Tex-Ray Industrial appears to be getting more proficient at generating returns since capital employed has remained flat but earnings (before interest and tax) are up. Considering the stock has delivered 12% to its stockholders over the last five years, it may be fair to think that investors aren't fully aware of the promising trends yet. So exploring more about this stock could uncover a good opportunity, if the valuation and other metrics stack up.
On a separate note, we've found 1 warning sign for Tex-Ray Industrial you'll probably want to know about.
While Tex-Ray Industrial isn't earning the highest return, check out this free list of companies that are earning high returns on equity with solid balance sheets.
If you decide to trade Tex-Ray Industrial, use the lowest-cost* platform that is rated #1 Overall by Barron’s, Interactive Brokers. Trade stocks, options, futures, forex, bonds and funds on 135 markets, all from a single integrated account. Promoted
Valuation is complex, but we're here to simplify it.
Discover if Tex-Ray Industrial might be undervalued or overvalued with our detailed analysis, featuring fair value estimates, potential risks, dividends, insider trades, and its financial condition.
Access Free AnalysisThis article by Simply Wall St is general in nature. It does not constitute a recommendation to buy or sell any stock, and does not take account of your objectives, or your financial situation. We aim to bring you long-term focused analysis driven by fundamental data. Note that our analysis may not factor in the latest price-sensitive company announcements or qualitative material. Simply Wall St has no position in any stocks mentioned.
*Interactive Brokers Rated Lowest Cost Broker by StockBrokers.com Annual Online Review 2020
Have feedback on this article? Concerned about the content? Get in touch with us directly. Alternatively, email editorial-team (at) simplywallst.com.
About TWSE:1467
Tex-Ray Industrial
Engages in weaving, manufacturing, processing, dyeing, spinning, finishing, printing, and trading of cottons, fibers, textiles, and yarns.
Adequate balance sheet and slightly overvalued.
Similar Companies
Market Insights

Advertisement
Community Narratives
MicroVision will explode future revenue by 380.37% with a vision towards success
Fair Value US$60.00|98.4% undervalued
TH
Community Contributor
The Indispensable Artery for a New North American Economy
Fair Value CA$132.87|1.3% undervalued
TI
Community Contributor