
Advertisement
- Taiwan
- /
- Commercial Services
- /
- TPEX:8390
Will The ROCE Trend At Jiin Yeeh Ding Enterprises (GTSM:8390) Continue?
What are the early trends we should look for to identify a stock that could multiply in value over the long term? Ideally, a business will show two trends; firstly a growing return on capital employed (ROCE) and secondly, an increasing amount of capital employed. Put simply, these types of businesses are compounding machines, meaning they are continually reinvesting their earnings at ever-higher rates of return. So when we looked at Jiin Yeeh Ding Enterprises (GTSM:8390) and its trend of ROCE, we really liked what we saw.
Understanding Return On Capital Employed (ROCE)
For those that aren't sure what ROCE is, it measures the amount of pre-tax profits a company can generate from the capital employed in its business. Analysts use this formula to calculate it for Jiin Yeeh Ding Enterprises:
Return on Capital Employed = Earnings Before Interest and Tax (EBIT) ÷ (Total Assets - Current Liabilities)
0.12 = NT$309m ÷ (NT$3.1b - NT$538m) (Based on the trailing twelve months to September 2020).
So, Jiin Yeeh Ding Enterprises has an ROCE of 12%. On its own, that's a standard return, however it's much better than the 5.0% generated by the Commercial Services industry.
See our latest analysis for Jiin Yeeh Ding Enterprises
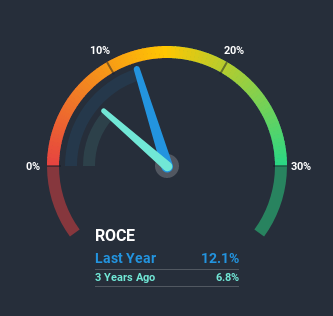
Historical performance is a great place to start when researching a stock so above you can see the gauge for Jiin Yeeh Ding Enterprises' ROCE against it's prior returns. If you want to delve into the historical earnings, revenue and cash flow of Jiin Yeeh Ding Enterprises, check out these free graphs here.
How Are Returns Trending?
We're delighted to see that Jiin Yeeh Ding Enterprises is reaping rewards from its investments and has now broken into profitability. The company now earns 12% on its capital, because five years ago it was incurring losses. While returns have increased, the amount of capital employed by Jiin Yeeh Ding Enterprises has remained flat over the period. With no noticeable increase in capital employed, it's worth knowing what the company plans on doing going forward in regards to reinvesting and growing the business. So if you're looking for high growth, you'll want to see a business's capital employed also increasing.
In another part of our analysis, we noticed that the company's ratio of current liabilities to total assets decreased to 17%, which broadly means the business is relying less on its suppliers or short-term creditors to fund its operations. So shareholders would be pleased that the growth in returns has mostly come from underlying business performance.
The Bottom Line
In summary, we're delighted to see that Jiin Yeeh Ding Enterprises has been able to increase efficiencies and earn higher rates of return on the same amount of capital. And with the stock having performed exceptionally well over the last five years, these patterns are being accounted for by investors. In light of that, we think it's worth looking further into this stock because if Jiin Yeeh Ding Enterprises can keep these trends up, it could have a bright future ahead.
If you want to continue researching Jiin Yeeh Ding Enterprises, you might be interested to know about the 2 warning signs that our analysis has discovered.
While Jiin Yeeh Ding Enterprises isn't earning the highest return, check out this free list of companies that are earning high returns on equity with solid balance sheets.
If you decide to trade Jiin Yeeh Ding Enterprises, use the lowest-cost* platform that is rated #1 Overall by Barron’s, Interactive Brokers. Trade stocks, options, futures, forex, bonds and funds on 135 markets, all from a single integrated account. Promoted
New: Manage All Your Stock Portfolios in One Place
We've created the ultimate portfolio companion for stock investors, and it's free.
• Connect an unlimited number of Portfolios and see your total in one currency
• Be alerted to new Warning Signs or Risks via email or mobile
• Track the Fair Value of your stocks
This article by Simply Wall St is general in nature. It does not constitute a recommendation to buy or sell any stock, and does not take account of your objectives, or your financial situation. We aim to bring you long-term focused analysis driven by fundamental data. Note that our analysis may not factor in the latest price-sensitive company announcements or qualitative material. Simply Wall St has no position in any stocks mentioned.
*Interactive Brokers Rated Lowest Cost Broker by StockBrokers.com Annual Online Review 2020
Have feedback on this article? Concerned about the content? Get in touch with us directly. Alternatively, email editorial-team (at) simplywallst.com.
About TPEX:8390
Jiin Yeeh Ding Enterprises
A professional electronic waste recycling and treatment company, provides e-waste disposal service for the technology companies in Taiwan.
Flawless balance sheet with solid track record and pays a dividend.
Market Insights

Advertisement
Community Narratives
MicroVision will explode future revenue by 380.37% with a vision towards success
Fair Value US$60.00|98.4% undervalued
TH
Community Contributor
The Indispensable Artery for a New North American Economy
Fair Value CA$132.87|1.3% undervalued
TI
Community Contributor