
Advertisement
- Taiwan
- /
- Commercial Services
- /
- TPEX:8390
What To Know Before Buying Jiin Yeeh Ding Enterprises Corp. (GTSM:8390) For Its Dividend
Today we'll take a closer look at Jiin Yeeh Ding Enterprises Corp. (GTSM:8390) from a dividend investor's perspective. Owning a strong business and reinvesting the dividends is widely seen as an attractive way of growing your wealth. If you are hoping to live on your dividends, it's important to be more stringent with your investments than the average punter. Regular readers know we like to apply the same approach to each dividend stock, and we hope you'll find our analysis useful.
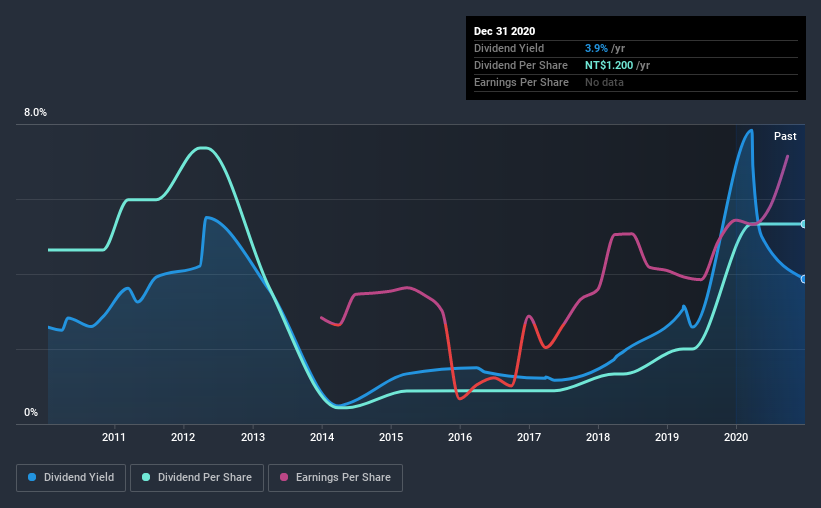
In this case, Jiin Yeeh Ding Enterprises likely looks attractive to investors, given its 3.9% dividend yield and a payment history of over ten years. We'd guess that plenty of investors have purchased it for the income. During the year, the company also conducted a buyback equivalent to around 1.8% of its market capitalisation. That said, the recent jump in the share price will make Jiin Yeeh Ding Enterprises's dividend yield look smaller, even though the company prospects could be improving. Before you buy any stock for its dividend however, you should always remember Warren Buffett's two rules: 1) Don't lose money, and 2) Remember rule #1. We'll run through some checks below to help with this.
Explore this interactive chart for our latest analysis on Jiin Yeeh Ding Enterprises!
Payout ratios
Dividends are typically paid from company earnings. If a company pays more in dividends than it earned, then the dividend might become unsustainable - hardly an ideal situation. As a result, we should always investigate whether a company can afford its dividend, measured as a percentage of a company's net income after tax. Looking at the data, we can see that 48% of Jiin Yeeh Ding Enterprises' profits were paid out as dividends in the last 12 months. This is a medium payout level that leaves enough capital in the business to fund opportunities that might arise, while also rewarding shareholders. Plus, there is room to increase the payout ratio over time.
Another important check we do is to see if the free cash flow generated is sufficient to pay the dividend. Of the free cash flow it generated last year, Jiin Yeeh Ding Enterprises paid out 42% as dividends, suggesting the dividend is affordable. It's positive to see that Jiin Yeeh Ding Enterprises' dividend is covered by both profits and cash flow, since this is generally a sign that the dividend is sustainable, and a lower payout ratio usually suggests a greater margin of safety before the dividend gets cut.
While the above analysis focuses on dividends relative to a company's earnings, we do note Jiin Yeeh Ding Enterprises' strong net cash position, which will let it pay larger dividends for a time, should it choose.
Remember, you can always get a snapshot of Jiin Yeeh Ding Enterprises' latest financial position, by checking our visualisation of its financial health.
Dividend Volatility
Before buying a stock for its income, we want to see if the dividends have been stable in the past, and if the company has a track record of maintaining its dividend. Jiin Yeeh Ding Enterprises has been paying dividends for a long time, but for the purpose of this analysis, we only examine the past 10 years of payments. This dividend has been unstable, which we define as having been cut one or more times over this time. During the past 10-year period, the first annual payment was NT$1.0 in 2010, compared to NT$1.2 last year. Dividends per share have grown at approximately 1.4% per year over this time. The dividends haven't grown at precisely 1.4% every year, but this is a useful way to average out the historical rate of growth.
It's good to see some dividend growth, but the dividend has been cut at least once, and the size of the cut would eliminate most of the growth, anyway. We're not that enthused by this.
Dividend Growth Potential
With a relatively unstable dividend, it's even more important to see if earnings per share (EPS) are growing. Why take the risk of a dividend getting cut, unless there's a good chance of bigger dividends in future? It's good to see Jiin Yeeh Ding Enterprises has been growing its earnings per share at 67% a year over the past five years. With high earnings per share growth in recent times and a modest payout ratio, we think this is an attractive combination if earnings can be reinvested to generate further growth.
Conclusion
Dividend investors should always want to know if a) a company's dividends are affordable, b) if there is a track record of consistent payments, and c) if the dividend is capable of growing. First, we like that the company's dividend payments appear well covered, although the retained capital also needs to be effectively reinvested. Next, earnings growth has been good, but unfortunately the dividend has been cut at least once in the past. Overall we think Jiin Yeeh Ding Enterprises scores well on our analysis. It's not quite perfect, but we'd definitely be keen to take a closer look.
Market movements attest to how highly valued a consistent dividend policy is compared to one which is more unpredictable. Still, investors need to consider a host of other factors, apart from dividend payments, when analysing a company. As an example, we've identified 3 warning signs for Jiin Yeeh Ding Enterprises that you should be aware of before investing.
Looking for more high-yielding dividend ideas? Try our curated list of dividend stocks with a yield above 3%.
When trading Jiin Yeeh Ding Enterprises or any other investment, use the platform considered by many to be the Professional's Gateway to the Worlds Market, Interactive Brokers. You get the lowest-cost* trading on stocks, options, futures, forex, bonds and funds worldwide from a single integrated account. Promoted
New: Manage All Your Stock Portfolios in One Place
We've created the ultimate portfolio companion for stock investors, and it's free.
• Connect an unlimited number of Portfolios and see your total in one currency
• Be alerted to new Warning Signs or Risks via email or mobile
• Track the Fair Value of your stocks
This article by Simply Wall St is general in nature. It does not constitute a recommendation to buy or sell any stock, and does not take account of your objectives, or your financial situation. We aim to bring you long-term focused analysis driven by fundamental data. Note that our analysis may not factor in the latest price-sensitive company announcements or qualitative material. Simply Wall St has no position in any stocks mentioned.
*Interactive Brokers Rated Lowest Cost Broker by StockBrokers.com Annual Online Review 2020
Have feedback on this article? Concerned about the content? Get in touch with us directly. Alternatively, email editorial-team (at) simplywallst.com.
About TPEX:8390
Jiin Yeeh Ding Enterprises
A professional electronic waste recycling and treatment company, provides e-waste disposal service for the technology companies in Taiwan.
Flawless balance sheet with solid track record and pays a dividend.
Market Insights

Advertisement
Community Narratives
MicroVision will explode future revenue by 380.37% with a vision towards success
Fair Value US$60.00|98.4% undervalued
TH
Community Contributor
The Indispensable Artery for a New North American Economy
Fair Value CA$132.87|1.3% undervalued
TI
Community Contributor