- Taiwan
- /
- Electrical
- /
- TWSE:6133
Has Golden Bridge Electech Inc.'s (TWSE:6133) Impressive Stock Performance Got Anything to Do With Its Fundamentals?


Most readers would already be aware that Golden Bridge Electech's (TWSE:6133) stock increased significantly by 48% over the past three months. As most would know, fundamentals are what usually guide market price movements over the long-term, so we decided to look at the company's key financial indicators today to determine if they have any role to play in the recent price movement. Specifically, we decided to study Golden Bridge Electech's ROE in this article.
Return on Equity or ROE is a test of how effectively a company is growing its value and managing investors’ money. In other words, it is a profitability ratio which measures the rate of return on the capital provided by the company's shareholders.
View our latest analysis for Golden Bridge Electech
How To Calculate Return On Equity?
The formula for return on equity is:
Return on Equity = Net Profit (from continuing operations) ÷ Shareholders' Equity
So, based on the above formula, the ROE for Golden Bridge Electech is:
4.1% = NT$48m ÷ NT$1.2b (Based on the trailing twelve months to June 2024).
The 'return' refers to a company's earnings over the last year. Another way to think of that is that for every NT$1 worth of equity, the company was able to earn NT$0.04 in profit.
What Is The Relationship Between ROE And Earnings Growth?
So far, we've learned that ROE is a measure of a company's profitability. We now need to evaluate how much profit the company reinvests or "retains" for future growth which then gives us an idea about the growth potential of the company. Generally speaking, other things being equal, firms with a high return on equity and profit retention, have a higher growth rate than firms that don’t share these attributes.
A Side By Side comparison of Golden Bridge Electech's Earnings Growth And 4.1% ROE
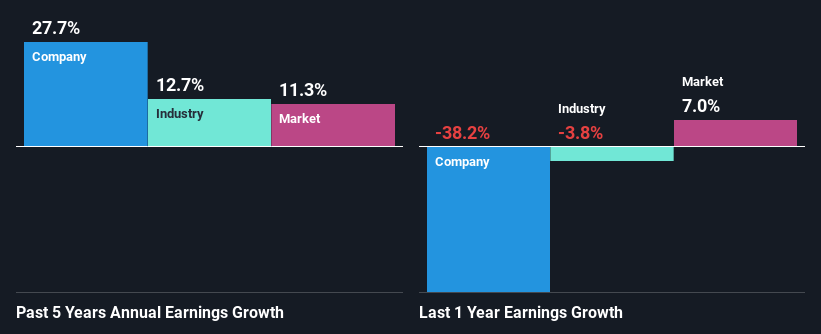
On the face of it, Golden Bridge Electech's ROE is not much to talk about. A quick further study shows that the company's ROE doesn't compare favorably to the industry average of 9.0% either. In spite of this, Golden Bridge Electech was able to grow its net income considerably, at a rate of 28% in the last five years. Therefore, there could be other reasons behind this growth. For instance, the company has a low payout ratio or is being managed efficiently.
We then compared Golden Bridge Electech's net income growth with the industry and we're pleased to see that the company's growth figure is higher when compared with the industry which has a growth rate of 13% in the same 5-year period.
Earnings growth is a huge factor in stock valuation. The investor should try to establish if the expected growth or decline in earnings, whichever the case may be, is priced in. By doing so, they will have an idea if the stock is headed into clear blue waters or if swampy waters await. If you're wondering about Golden Bridge Electech's's valuation, check out this gauge of its price-to-earnings ratio, as compared to its industry.
Is Golden Bridge Electech Efficiently Re-investing Its Profits?
While the company did pay out a portion of its dividend in the past, it currently doesn't pay a regular dividend. This is likely what's driving the high earnings growth number discussed above.
Summary
In total, it does look like Golden Bridge Electech has some positive aspects to its business. Even in spite of the low rate of return, the company has posted impressive earnings growth as a result of reinvesting heavily into its business. So far, we've only made a quick discussion around the company's earnings growth. So it may be worth checking this free detailed graph of Golden Bridge Electech's past earnings, as well as revenue and cash flows to get a deeper insight into the company's performance.
New: Manage All Your Stock Portfolios in One Place
We've created the ultimate portfolio companion for stock investors, and it's free.
• Connect an unlimited number of Portfolios and see your total in one currency
• Be alerted to new Warning Signs or Risks via email or mobile
• Track the Fair Value of your stocks
Have feedback on this article? Concerned about the content? Get in touch with us directly. Alternatively, email editorial-team (at) simplywallst.com.
This article by Simply Wall St is general in nature. We provide commentary based on historical data and analyst forecasts only using an unbiased methodology and our articles are not intended to be financial advice. It does not constitute a recommendation to buy or sell any stock, and does not take account of your objectives, or your financial situation. We aim to bring you long-term focused analysis driven by fundamental data. Note that our analysis may not factor in the latest price-sensitive company announcements or qualitative material. Simply Wall St has no position in any stocks mentioned.
About TWSE:6133
Golden Bridge Electech
Engages in the design, manufacture, assembly, and sale of various cable products in Taiwan.
Adequate balance sheet with questionable track record.

