Stock Analysis
Are Strong Financial Prospects The Force That Is Driving The Momentum In Apex Dynamics, Inc.'s TWSE:4583) Stock?


Apex Dynamics (TWSE:4583) has had a great run on the share market with its stock up by a significant 14% over the last three months. Given the company's impressive performance, we decided to study its financial indicators more closely as a company's financial health over the long-term usually dictates market outcomes. Particularly, we will be paying attention to Apex Dynamics' ROE today.
ROE or return on equity is a useful tool to assess how effectively a company can generate returns on the investment it received from its shareholders. Simply put, it is used to assess the profitability of a company in relation to its equity capital.
Check out our latest analysis for Apex Dynamics
How To Calculate Return On Equity?
The formula for ROE is:
Return on Equity = Net Profit (from continuing operations) ÷ Shareholders' Equity
So, based on the above formula, the ROE for Apex Dynamics is:
8.9% = NT$873m ÷ NT$9.9b (Based on the trailing twelve months to December 2023).
The 'return' is the profit over the last twelve months. One way to conceptualize this is that for each NT$1 of shareholders' capital it has, the company made NT$0.09 in profit.
What Is The Relationship Between ROE And Earnings Growth?
So far, we've learned that ROE is a measure of a company's profitability. We now need to evaluate how much profit the company reinvests or "retains" for future growth which then gives us an idea about the growth potential of the company. Generally speaking, other things being equal, firms with a high return on equity and profit retention, have a higher growth rate than firms that don’t share these attributes.
A Side By Side comparison of Apex Dynamics' Earnings Growth And 8.9% ROE
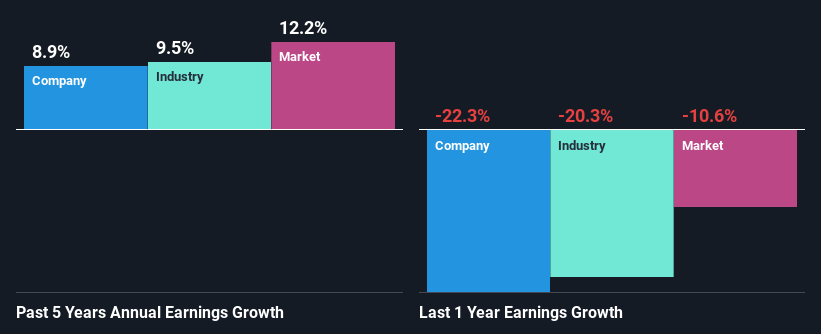
To start with, Apex Dynamics' ROE looks acceptable. Further, the company's ROE is similar to the industry average of 9.3%. This probably goes some way in explaining Apex Dynamics' moderate 8.9% growth over the past five years amongst other factors.
As a next step, we compared Apex Dynamics' net income growth with the industry and found that the company has a similar growth figure when compared with the industry average growth rate of 9.5% in the same period.
The basis for attaching value to a company is, to a great extent, tied to its earnings growth. What investors need to determine next is if the expected earnings growth, or the lack of it, is already built into the share price. Doing so will help them establish if the stock's future looks promising or ominous. Is Apex Dynamics fairly valued compared to other companies? These 3 valuation measures might help you decide.
Is Apex Dynamics Efficiently Re-investing Its Profits?
While Apex Dynamics has a three-year median payout ratio of 60% (which means it retains 40% of profits), the company has still seen a fair bit of earnings growth in the past, meaning that its high payout ratio hasn't hampered its ability to grow.
Moreover, Apex Dynamics is determined to keep sharing its profits with shareholders which we infer from its long history of three years of paying a dividend.
Conclusion
In total, we are pretty happy with Apex Dynamics' performance. In particular, its high ROE is quite noteworthy and also the probable explanation behind its considerable earnings growth. Yet, the company is retaining a small portion of its profits. Which means that the company has been able to grow its earnings in spite of it, so that's not too bad. Up till now, we've only made a short study of the company's growth data. You can do your own research on Apex Dynamics and see how it has performed in the past by looking at this FREE detailed graph of past earnings, revenue and cash flows.
Valuation is complex, but we're helping make it simple.
Find out whether Apex Dynamics is potentially over or undervalued by checking out our comprehensive analysis, which includes fair value estimates, risks and warnings, dividends, insider transactions and financial health.
View the Free AnalysisHave feedback on this article? Concerned about the content? Get in touch with us directly. Alternatively, email editorial-team (at) simplywallst.com.
This article by Simply Wall St is general in nature. We provide commentary based on historical data and analyst forecasts only using an unbiased methodology and our articles are not intended to be financial advice. It does not constitute a recommendation to buy or sell any stock, and does not take account of your objectives, or your financial situation. We aim to bring you long-term focused analysis driven by fundamental data. Note that our analysis may not factor in the latest price-sensitive company announcements or qualitative material. Simply Wall St has no position in any stocks mentioned.
About TWSE:4583
Apex Dynamics
Apex Dynamics, Inc. produces robots for plastics injection molding machines.
Flawless balance sheet second-rate dividend payer.
