Investors more bullish on Shin Zu Shing (TWSE:3376) this week as stock rallies 6.1%, despite earnings trending downwards over past year


Unfortunately, investing is risky - companies can and do go bankrupt. But if you pick the right business to buy shares in, you can make more than you can lose. Take, for example Shin Zu Shing Co., Ltd. (TWSE:3376). Its share price is already up an impressive 161% in the last twelve months. On top of that, the share price is up 56% in about a quarter. It is also impressive that the stock is up 91% over three years, adding to the sense that it is a real winner.
On the back of a solid 7-day performance, let's check what role the company's fundamentals have played in driving long term shareholder returns.
See our latest analysis for Shin Zu Shing
There is no denying that markets are sometimes efficient, but prices do not always reflect underlying business performance. One imperfect but simple way to consider how the market perception of a company has shifted is to compare the change in the earnings per share (EPS) with the share price movement.
During the last year, Shin Zu Shing actually saw its earnings per share drop 31%.
So we don't think that investors are paying too much attention to EPS. Since the change in EPS doesn't seem to correlate with the change in share price, it's worth taking a look at other metrics.
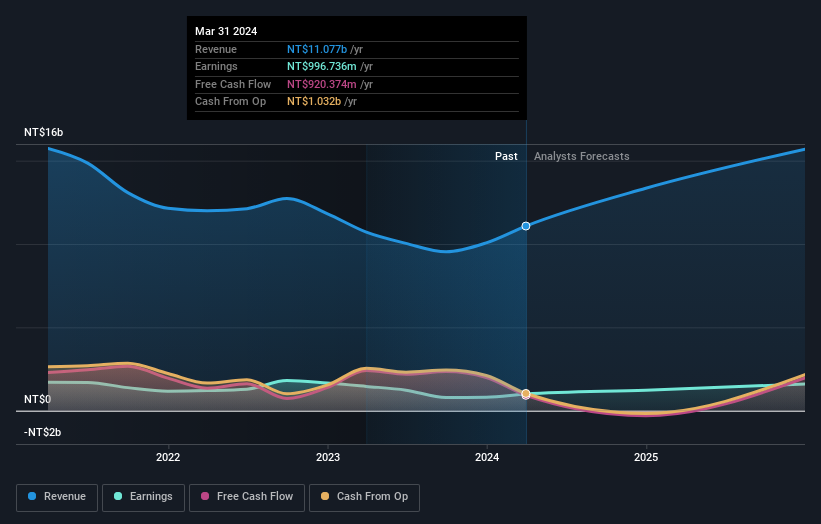
We are skeptical of the suggestion that the 1.7% dividend yield would entice buyers to the stock. However the year on year revenue growth of 3.4% would help. Many businesses do go through a phase where they have to forgo some profits to drive business development, and sometimes its for the best.
You can see how earnings and revenue have changed over time in the image below (click on the chart to see the exact values).
Balance sheet strength is crucial. It might be well worthwhile taking a look at our free report on how its financial position has changed over time.
What About Dividends?
It is important to consider the total shareholder return, as well as the share price return, for any given stock. The TSR incorporates the value of any spin-offs or discounted capital raisings, along with any dividends, based on the assumption that the dividends are reinvested. It's fair to say that the TSR gives a more complete picture for stocks that pay a dividend. As it happens, Shin Zu Shing's TSR for the last 1 year was 179%, which exceeds the share price return mentioned earlier. And there's no prize for guessing that the dividend payments largely explain the divergence!
A Different Perspective
We're pleased to report that Shin Zu Shing shareholders have received a total shareholder return of 179% over one year. That's including the dividend. Since the one-year TSR is better than the five-year TSR (the latter coming in at 20% per year), it would seem that the stock's performance has improved in recent times. In the best case scenario, this may hint at some real business momentum, implying that now could be a great time to delve deeper. It's always interesting to track share price performance over the longer term. But to understand Shin Zu Shing better, we need to consider many other factors. For example, we've discovered 3 warning signs for Shin Zu Shing that you should be aware of before investing here.
We will like Shin Zu Shing better if we see some big insider buys. While we wait, check out this free list of undervalued stocks (mostly small caps) with considerable, recent, insider buying.
Please note, the market returns quoted in this article reflect the market weighted average returns of stocks that currently trade on Taiwanese exchanges.
New: Manage All Your Stock Portfolios in One Place
We've created the ultimate portfolio companion for stock investors, and it's free.
• Connect an unlimited number of Portfolios and see your total in one currency
• Be alerted to new Warning Signs or Risks via email or mobile
• Track the Fair Value of your stocks
Have feedback on this article? Concerned about the content? Get in touch with us directly. Alternatively, email editorial-team (at) simplywallst.com.
This article by Simply Wall St is general in nature. We provide commentary based on historical data and analyst forecasts only using an unbiased methodology and our articles are not intended to be financial advice. It does not constitute a recommendation to buy or sell any stock, and does not take account of your objectives, or your financial situation. We aim to bring you long-term focused analysis driven by fundamental data. Note that our analysis may not factor in the latest price-sensitive company announcements or qualitative material. Simply Wall St has no position in any stocks mentioned.
Have feedback on this article? Concerned about the content? Get in touch with us directly. Alternatively, email editorial-team@simplywallst.com
About TWSE:3376
Shin Zu Shing
Engages in the research, design, development, production, assembly, testing, manufacturing, and trading of various precision springs, stamping parts, hinge components, CNC lathes, and metal injection molding in Taiwan, Singapore, and China.
Reasonable growth potential with adequate balance sheet.

