- Taiwan
- /
- Construction
- /
- TWSE:1438
SanDi PropertiesLtd (TWSE:1438) shareholder returns have been strong, earning 236% in 5 years


When you buy a stock there is always a possibility that it could drop 100%. But when you pick a company that is really flourishing, you can make more than 100%. Long term SanDi Properties Co.,Ltd. (TWSE:1438) shareholders would be well aware of this, since the stock is up 208% in five years. Also pleasing for shareholders was the 38% gain in the last three months. But this move may well have been assisted by the reasonably buoyant market (up 19% in 90 days).
The past week has proven to be lucrative for SanDi PropertiesLtd investors, so let's see if fundamentals drove the company's five-year performance.
Check out our latest analysis for SanDi PropertiesLtd
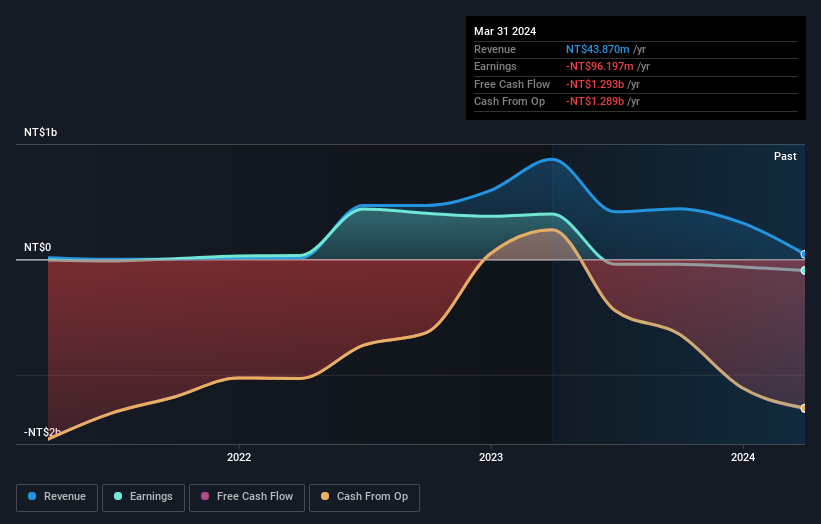
Because SanDi PropertiesLtd made a loss in the last twelve months, we think the market is probably more focussed on revenue and revenue growth, at least for now. Shareholders of unprofitable companies usually desire strong revenue growth. That's because fast revenue growth can be easily extrapolated to forecast profits, often of considerable size.
For the last half decade, SanDi PropertiesLtd can boast revenue growth at a rate of 53% per year. That's well above most pre-profit companies. So it's not entirely surprising that the share price reflected this performance by increasing at a rate of 25% per year, in that time. This suggests the market has well and truly recognized the progress the business has made. To our minds that makes SanDi PropertiesLtd worth investigating - it may have its best days ahead.
The graphic below depicts how earnings and revenue have changed over time (unveil the exact values by clicking on the image).
You can see how its balance sheet has strengthened (or weakened) over time in this free interactive graphic.
What About The Total Shareholder Return (TSR)?
We've already covered SanDi PropertiesLtd's share price action, but we should also mention its total shareholder return (TSR). The TSR is a return calculation that accounts for the value of cash dividends (assuming that any dividend received was reinvested) and the calculated value of any discounted capital raisings and spin-offs. Its history of dividend payouts mean that SanDi PropertiesLtd's TSR of 236% over the last 5 years is better than the share price return.
A Different Perspective
It's nice to see that SanDi PropertiesLtd shareholders have received a total shareholder return of 148% over the last year. Since the one-year TSR is better than the five-year TSR (the latter coming in at 27% per year), it would seem that the stock's performance has improved in recent times. In the best case scenario, this may hint at some real business momentum, implying that now could be a great time to delve deeper. I find it very interesting to look at share price over the long term as a proxy for business performance. But to truly gain insight, we need to consider other information, too. Consider for instance, the ever-present spectre of investment risk. We've identified 2 warning signs with SanDi PropertiesLtd (at least 1 which is a bit unpleasant) , and understanding them should be part of your investment process.
For those who like to find winning investments this free list of undervalued companies with recent insider purchasing, could be just the ticket.
Please note, the market returns quoted in this article reflect the market weighted average returns of stocks that currently trade on Taiwanese exchanges.
New: Manage All Your Stock Portfolios in One Place
We've created the ultimate portfolio companion for stock investors, and it's free.
• Connect an unlimited number of Portfolios and see your total in one currency
• Be alerted to new Warning Signs or Risks via email or mobile
• Track the Fair Value of your stocks
Have feedback on this article? Concerned about the content? Get in touch with us directly. Alternatively, email editorial-team (at) simplywallst.com.
This article by Simply Wall St is general in nature. We provide commentary based on historical data and analyst forecasts only using an unbiased methodology and our articles are not intended to be financial advice. It does not constitute a recommendation to buy or sell any stock, and does not take account of your objectives, or your financial situation. We aim to bring you long-term focused analysis driven by fundamental data. Note that our analysis may not factor in the latest price-sensitive company announcements or qualitative material. Simply Wall St has no position in any stocks mentioned.
Have feedback on this article? Concerned about the content? Get in touch with us directly. Alternatively, email editorial-team@simplywallst.com
About TWSE:1438
SanDi PropertiesLtd
Engages in the construction of commercial and industrial buildings in Taiwan.
Low with imperfect balance sheet.

