
Advertisement
Today we will run through one way of estimating the intrinsic value of S-Tech Corp. (GTSM:1584) by taking the forecast future cash flows of the company and discounting them back to today's value. One way to achieve this is by employing the Discounted Cash Flow (DCF) model. Models like these may appear beyond the comprehension of a lay person, but they're fairly easy to follow.
Remember though, that there are many ways to estimate a company's value, and a DCF is just one method. For those who are keen learners of equity analysis, the Simply Wall St analysis model here may be something of interest to you.
See our latest analysis for S-Tech
What's the estimated valuation?
We use what is known as a 2-stage model, which simply means we have two different periods of growth rates for the company's cash flows. Generally the first stage is higher growth, and the second stage is a lower growth phase. In the first stage we need to estimate the cash flows to the business over the next ten years. Seeing as no analyst estimates of free cash flow are available to us, we have extrapolate the previous free cash flow (FCF) from the company's last reported value. We assume companies with shrinking free cash flow will slow their rate of shrinkage, and that companies with growing free cash flow will see their growth rate slow, over this period. We do this to reflect that growth tends to slow more in the early years than it does in later years.
Generally we assume that a dollar today is more valuable than a dollar in the future, and so the sum of these future cash flows is then discounted to today's value:
10-year free cash flow (FCF) forecast
| 2021 | 2022 | 2023 | 2024 | 2025 | 2026 | 2027 | 2028 | 2029 | 2030 | |
| Levered FCF (NT$, Millions) | NT$98.5m | NT$103.2m | NT$106.9m | NT$109.9m | NT$112.3m | NT$114.3m | NT$116.0m | NT$117.5m | NT$118.8m | NT$120.1m |
| Growth Rate Estimate Source | Est @ 6.46% | Est @ 4.77% | Est @ 3.59% | Est @ 2.76% | Est @ 2.18% | Est @ 1.78% | Est @ 1.49% | Est @ 1.29% | Est @ 1.15% | Est @ 1.06% |
| Present Value (NT$, Millions) Discounted @ 10% | NT$89.3 | NT$84.7 | NT$79.5 | NT$74.0 | NT$68.5 | NT$63.2 | NT$58.1 | NT$53.3 | NT$48.9 | NT$44.7 |
("Est" = FCF growth rate estimated by Simply Wall St)
Present Value of 10-year Cash Flow (PVCF) = NT$664m
After calculating the present value of future cash flows in the initial 10-year period, we need to calculate the Terminal Value, which accounts for all future cash flows beyond the first stage. The Gordon Growth formula is used to calculate Terminal Value at a future annual growth rate equal to the 5-year average of the 10-year government bond yield of 0.8%. We discount the terminal cash flows to today's value at a cost of equity of 10%.
Terminal Value (TV)= FCF2030 × (1 + g) ÷ (r – g) = NT$120m× (1 + 0.8%) ÷ (10%– 0.8%) = NT$1.3b
Present Value of Terminal Value (PVTV)= TV / (1 + r)10= NT$1.3b÷ ( 1 + 10%)10= NT$473m
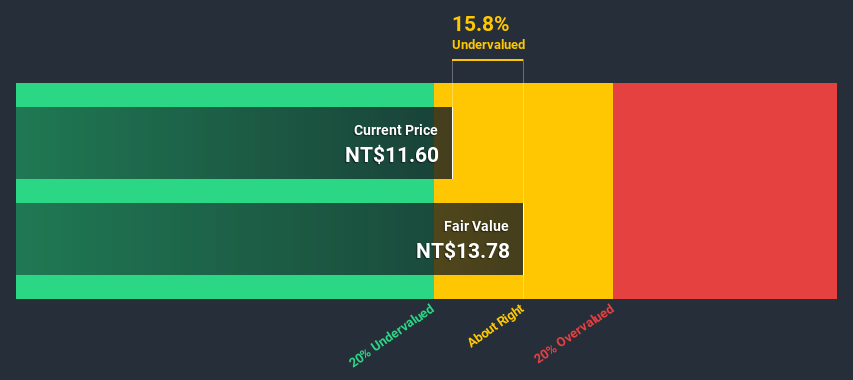
The total value is the sum of cash flows for the next ten years plus the discounted terminal value, which results in the Total Equity Value, which in this case is NT$1.1b. To get the intrinsic value per share, we divide this by the total number of shares outstanding. Compared to the current share price of NT$11.6, the company appears about fair value at a 16% discount to where the stock price trades currently. Remember though, that this is just an approximate valuation, and like any complex formula - garbage in, garbage out.
The assumptions
The calculation above is very dependent on two assumptions. The first is the discount rate and the other is the cash flows. You don't have to agree with these inputs, I recommend redoing the calculations yourself and playing with them. The DCF also does not consider the possible cyclicality of an industry, or a company's future capital requirements, so it does not give a full picture of a company's potential performance. Given that we are looking at S-Tech as potential shareholders, the cost of equity is used as the discount rate, rather than the cost of capital (or weighted average cost of capital, WACC) which accounts for debt. In this calculation we've used 10%, which is based on a levered beta of 1.560. Beta is a measure of a stock's volatility, compared to the market as a whole. We get our beta from the industry average beta of globally comparable companies, with an imposed limit between 0.8 and 2.0, which is a reasonable range for a stable business.
Next Steps:
Although the valuation of a company is important, it shouldn't be the only metric you look at when researching a company. DCF models are not the be-all and end-all of investment valuation. Instead the best use for a DCF model is to test certain assumptions and theories to see if they would lead to the company being undervalued or overvalued. If a company grows at a different rate, or if its cost of equity or risk free rate changes sharply, the output can look very different. For S-Tech, we've compiled three further factors you should assess:
- Risks: Every company has them, and we've spotted 3 warning signs for S-Tech (of which 1 doesn't sit too well with us!) you should know about.
- Other High Quality Alternatives: Do you like a good all-rounder? Explore our interactive list of high quality stocks to get an idea of what else is out there you may be missing!
- Other Top Analyst Picks: Interested to see what the analysts are thinking? Take a look at our interactive list of analysts' top stock picks to find out what they feel might have an attractive future outlook!
PS. The Simply Wall St app conducts a discounted cash flow valuation for every stock on the GTSM every day. If you want to find the calculation for other stocks just search here.
If you’re looking to trade S-Tech, open an account with the lowest-cost* platform trusted by professionals, Interactive Brokers. Their clients from over 200 countries and territories trade stocks, options, futures, forex, bonds and funds worldwide from a single integrated account. Promoted
New: Manage All Your Stock Portfolios in One Place
We've created the ultimate portfolio companion for stock investors, and it's free.
• Connect an unlimited number of Portfolios and see your total in one currency
• Be alerted to new Warning Signs or Risks via email or mobile
• Track the Fair Value of your stocks
This article by Simply Wall St is general in nature. It does not constitute a recommendation to buy or sell any stock, and does not take account of your objectives, or your financial situation. We aim to bring you long-term focused analysis driven by fundamental data. Note that our analysis may not factor in the latest price-sensitive company announcements or qualitative material. Simply Wall St has no position in any stocks mentioned.
*Interactive Brokers Rated Lowest Cost Broker by StockBrokers.com Annual Online Review 2020
Have feedback on this article? Concerned about the content? Get in touch with us directly. Alternatively, email editorial-team (at) simplywallst.com.
About TPEX:1584
S-Tech
Engages in the manufacture and sale of nonferrous alloy products in Taiwan.
Excellent balance sheet with low risk.
Market Insights

Advertisement
Community Narratives
MicroVision will explode future revenue by 380.37% with a vision towards success
Fair Value US$60.00|98.5% undervalued
TH
Community Contributor
The Indispensable Artery for a New North American Economy
Fair Value CA$132.87|2.3% undervalued
TI
Community Contributor