Investing in CTBC Financial Holding (TWSE:2891) three years ago would have delivered you a 66% gain


By buying an index fund, investors can approximate the average market return. But if you choose individual stocks with prowess, you can make superior returns. For example, the CTBC Financial Holding Co., Ltd. (TWSE:2891) share price is up 44% in the last three years, clearly besting the market return of around 21% (not including dividends). However, more recent returns haven't been as impressive as that, with the stock returning just 36% in the last year , including dividends .
With that in mind, it's worth seeing if the company's underlying fundamentals have been the driver of long term performance, or if there are some discrepancies.
View our latest analysis for CTBC Financial Holding
While the efficient markets hypothesis continues to be taught by some, it has been proven that markets are over-reactive dynamic systems, and investors are not always rational. One way to examine how market sentiment has changed over time is to look at the interaction between a company's share price and its earnings per share (EPS).
During three years of share price growth, CTBC Financial Holding achieved compound earnings per share growth of 4.3% per year. In comparison, the 13% per year gain in the share price outpaces the EPS growth. This indicates that the market is feeling more optimistic on the stock, after the last few years of progress. That's not necessarily surprising considering the three-year track record of earnings growth.
The image below shows how EPS has tracked over time (if you click on the image you can see greater detail).
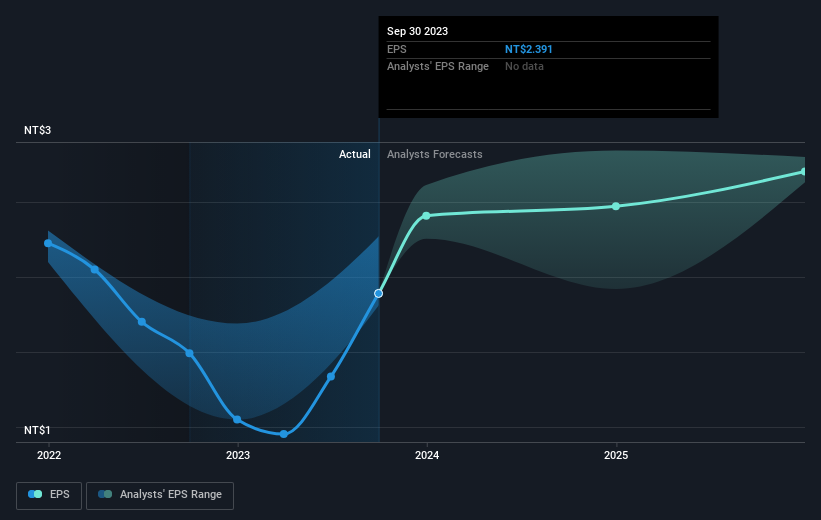
We know that CTBC Financial Holding has improved its bottom line lately, but is it going to grow revenue? If you're interested, you could check this free report showing consensus revenue forecasts.
What About Dividends?
It is important to consider the total shareholder return, as well as the share price return, for any given stock. The TSR incorporates the value of any spin-offs or discounted capital raisings, along with any dividends, based on the assumption that the dividends are reinvested. So for companies that pay a generous dividend, the TSR is often a lot higher than the share price return. In the case of CTBC Financial Holding, it has a TSR of 66% for the last 3 years. That exceeds its share price return that we previously mentioned. The dividends paid by the company have thusly boosted the total shareholder return.
A Different Perspective
It's nice to see that CTBC Financial Holding shareholders have received a total shareholder return of 36% over the last year. That's including the dividend. Since the one-year TSR is better than the five-year TSR (the latter coming in at 13% per year), it would seem that the stock's performance has improved in recent times. Someone with an optimistic perspective could view the recent improvement in TSR as indicating that the business itself is getting better with time. While it is well worth considering the different impacts that market conditions can have on the share price, there are other factors that are even more important. Take risks, for example - CTBC Financial Holding has 1 warning sign we think you should be aware of.
Of course CTBC Financial Holding may not be the best stock to buy. So you may wish to see this free collection of growth stocks.
Please note, the market returns quoted in this article reflect the market weighted average returns of stocks that currently trade on Taiwanese exchanges.
New: AI Stock Screener & Alerts
Our new AI Stock Screener scans the market every day to uncover opportunities.
• Dividend Powerhouses (3%+ Yield)
• Undervalued Small Caps with Insider Buying
• High growth Tech and AI Companies
Or build your own from over 50 metrics.
Have feedback on this article? Concerned about the content? Get in touch with us directly. Alternatively, email editorial-team (at) simplywallst.com.
This article by Simply Wall St is general in nature. We provide commentary based on historical data and analyst forecasts only using an unbiased methodology and our articles are not intended to be financial advice. It does not constitute a recommendation to buy or sell any stock, and does not take account of your objectives, or your financial situation. We aim to bring you long-term focused analysis driven by fundamental data. Note that our analysis may not factor in the latest price-sensitive company announcements or qualitative material. Simply Wall St has no position in any stocks mentioned.
About TWSE:2891
CTBC Financial Holding
Engages in the banking, bills financing, credit card, trust, insurance, securities, futures, venture capital, and other financial related business investment activities in Taiwan, Asia, and North America.
Solid track record established dividend payer.
