Advertisement
- Israel
- /
- Hospitality
- /
- TASE:TRA
Middle Eastern Penny Stocks To Watch In November 2025

Simply Wall St
Reviewed by Simply Wall St
Gulf markets have recently experienced a dip, with investors displaying caution ahead of significant global economic indicators such as Nvidia's earnings and U.S. jobs data, while weaker oil prices also contribute to the subdued sentiment. Despite these challenges, the Middle Eastern stock landscape still offers intriguing opportunities for investors willing to explore beyond the mainstream indices. Penny stocks, often representing smaller or newer companies, continue to hold potential for those seeking affordable entry points paired with growth prospects; here we examine several that stand out due to their financial strength and potential for long-term success.
Top 10 Penny Stocks In The Middle East
| Name | Share Price | Market Cap | Rewards & Risks |
| Thob Al Aseel (SASE:4012) | SAR3.35 | SAR1.34B | ✅ 2 ⚠️ 1 View Analysis > |
| Alarum Technologies (TASE:ALAR) | ₪3.959 | ₪283.84M | ✅ 4 ⚠️ 2 View Analysis > |
| E7 Group PJSC (ADX:E7) | AED1.00 | AED2.04B | ✅ 3 ⚠️ 3 View Analysis > |
| Sharjah Insurance Company P.S.C (ADX:SICO) | AED1.49 | AED225M | ✅ 2 ⚠️ 2 View Analysis > |
| Al Wathba National Insurance Company PJSC (ADX:AWNIC) | AED3.50 | AED724.5M | ✅ 2 ⚠️ 3 View Analysis > |
| Dubai National Insurance & Reinsurance (P.S.C.) (DFM:DNIR) | AED3.30 | AED377.69M | ✅ 2 ⚠️ 4 View Analysis > |
| Dubai Investments PJSC (DFM:DIC) | AED3.25 | AED13.95B | ✅ 3 ⚠️ 3 View Analysis > |
| Union Properties (DFM:UPP) | AED0.795 | AED2.26B | ✅ 2 ⚠️ 2 View Analysis > |
| Sharjah Cement and Industrial Development (PJSC) (ADX:SCIDC) | AED0.836 | AED501.81M | ✅ 2 ⚠️ 1 View Analysis > |
| Tgi Infrastructures (TASE:TGI) | ₪2.70 | ₪211.95M | ✅ 2 ⚠️ 2 View Analysis > |
Click here to see the full list of 80 stocks from our Middle Eastern Penny Stocks screener.
Let's uncover some gems from our specialized screener.
Hun Yenilenebilir Enerji Üretim (IBSE:HUNER)
Simply Wall St Financial Health Rating: ★★★★☆☆
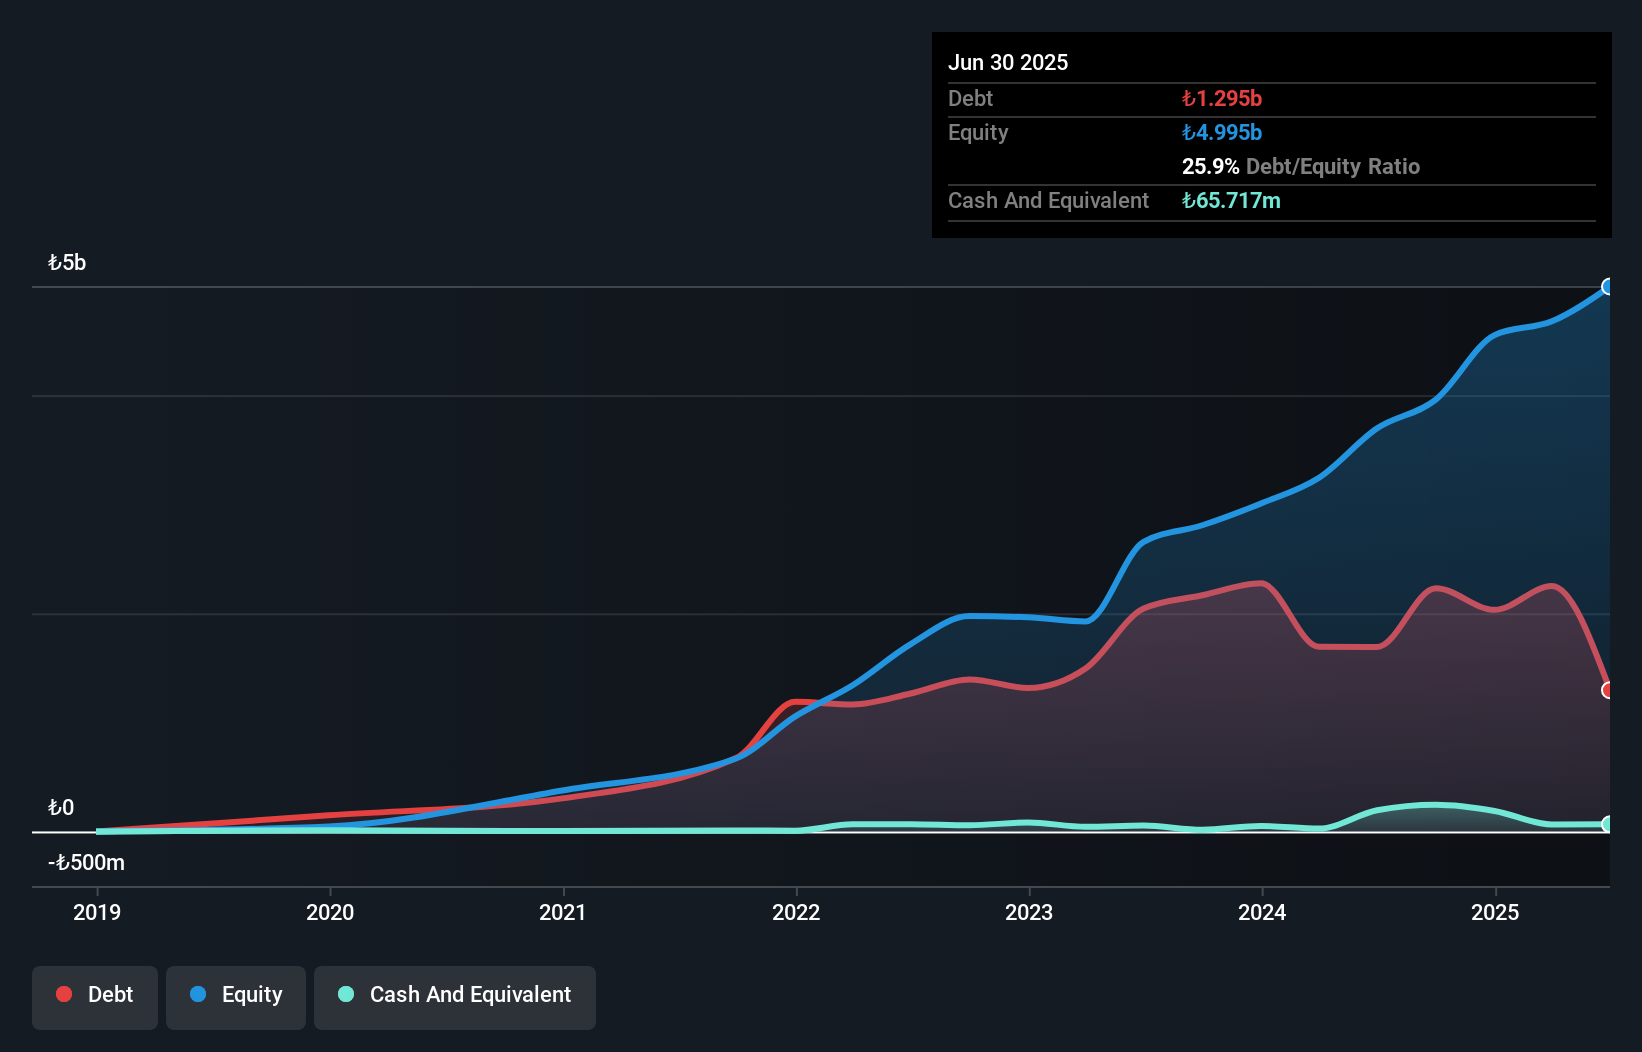
Overview: Hun Yenilenebilir Enerji Üretim A.S. operates in the renewable energy sector by establishing, constructing, commissioning, and renting electricity production facilities in Turkey and internationally, with a market cap of TRY3.50 billion.
Operations: The company generates revenue of TRY946.13 million from its production and sales activities.
Market Cap: TRY3.5B
Hun Yenilenebilir Enerji Üretim A.S. has shown promising financial improvements, becoming profitable within the last year and achieving a 14.7% annual earnings growth over five years. The company's debt management is commendable, with a net debt to equity ratio now at a satisfactory 39.3%. However, short-term assets of TRY428.5 million fall short of covering both short-term (TRY1.1 billion) and long-term liabilities (TRY2.6 billion). Despite these challenges, Hun's high-quality earnings and low price-to-earnings ratio (5.7x) compared to the Turkish market suggest potential value for investors in the renewable energy sector.
- Click to explore a detailed breakdown of our findings in Hun Yenilenebilir Enerji Üretim's financial health report.
- Gain insights into Hun Yenilenebilir Enerji Üretim's past trends and performance with our report on the company's historical track record.
Katmerciler Arac Üstü Ekipman Sanayi ve Ticaret (IBSE:KATMR)
Simply Wall St Financial Health Rating: ★★★★☆☆
Overview: Katmerciler Arac Üstü Ekipman Sanayi ve Ticaret A.S. operates in the manufacturing sector, focusing on producing vehicle-mounted equipment, with a market capitalization of TRY3.41 billion.
Operations: Katmerciler Arac Üstü Ekipman Sanayi ve Ticaret A.S. does not report specific revenue segments.
Market Cap: TRY3.41B
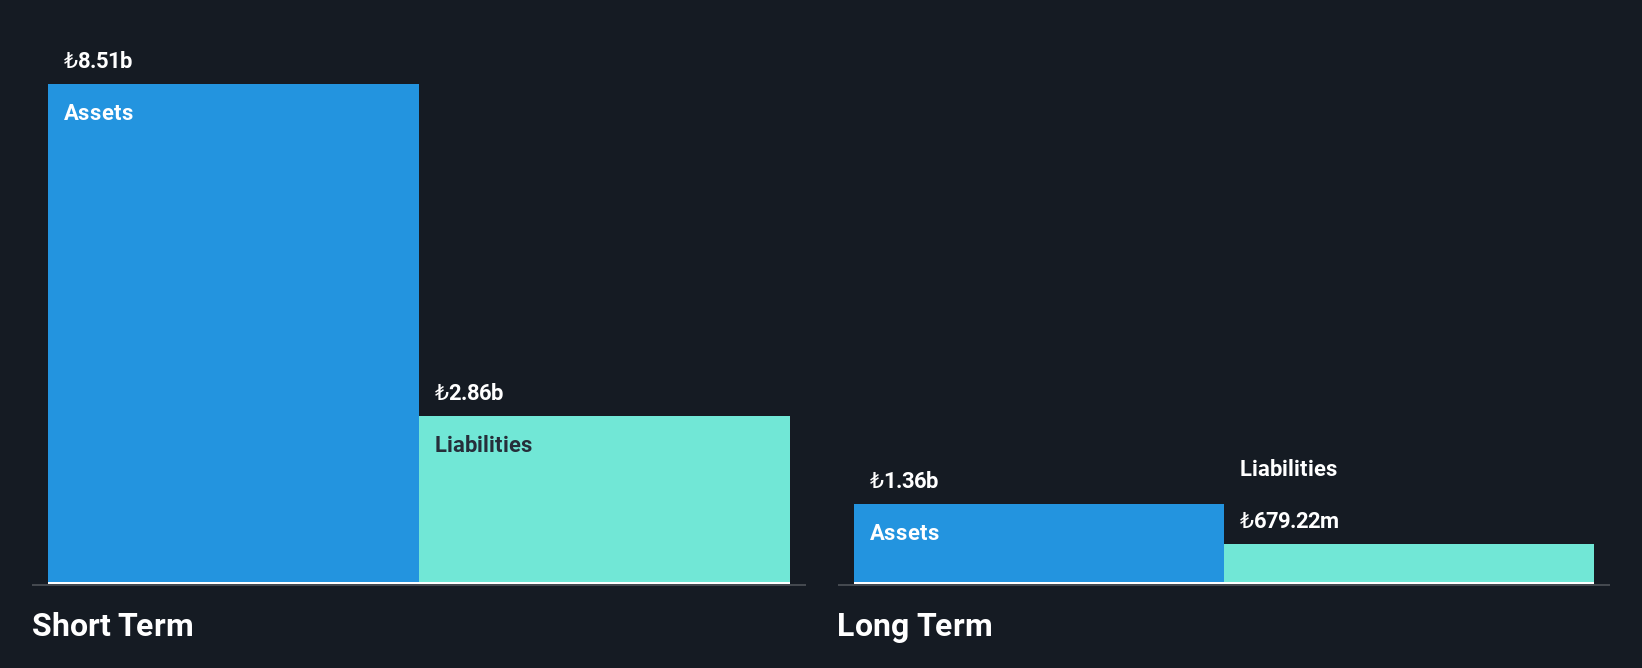
Katmerciler Arac Üstü Ekipman Sanayi ve Ticaret A.S. has recently achieved profitability, with third-quarter sales at TRY588.73 million, marking significant growth from the previous year. Despite a volatile share price and high weekly volatility compared to most Turkish stocks, the company maintains a stable financial position with short-term assets exceeding liabilities and a satisfactory net debt to equity ratio of 16.1%. However, its operating cash flow does not adequately cover debt obligations, and interest payments are not well covered by EBIT. The low price-to-earnings ratio of 5.2x suggests potential value for investors in this manufacturing stock.
- Navigate through the intricacies of Katmerciler Arac Üstü Ekipman Sanayi ve Ticaret with our comprehensive balance sheet health report here.
- Gain insights into Katmerciler Arac Üstü Ekipman Sanayi ve Ticaret's historical outcomes by reviewing our past performance report.
Tarya Israel (TASE:TRA)
Simply Wall St Financial Health Rating: ★★★★★☆
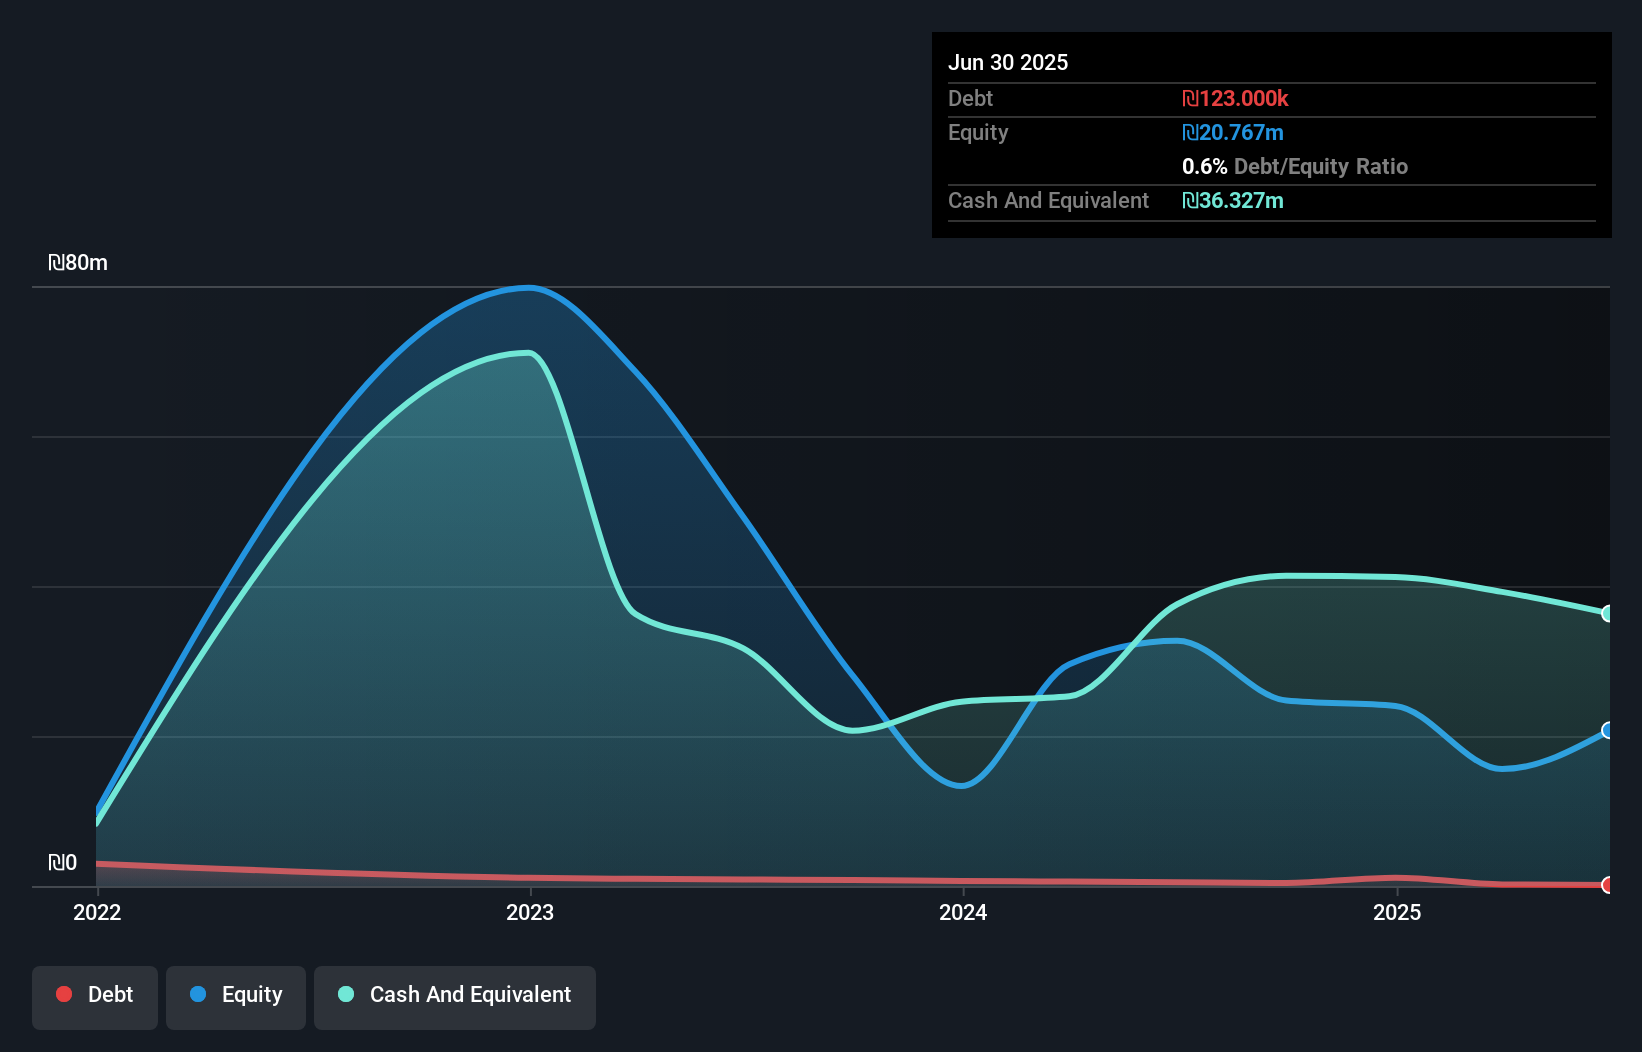
Overview: Tarya Israel Ltd, along with its subsidiaries, operates an internet platform in Israel and has a market cap of ₪168.91 million.
Operations: The company's revenue is primarily derived from its credit brokerage segment, which generated ₪41.13 million, with an additional contribution of ₪0.30 million from credit provision activities.
Market Cap: ₪168.91M
Tarya Israel Ltd, with a market cap of ₪168.91 million, operates primarily in the credit brokerage sector, generating revenue of ₪41.13 million. Despite being unprofitable with a negative return on equity of -12.36%, it has reduced losses by 42.8% annually over five years and maintains more cash than debt, ensuring financial stability for over three years if free cash flow continues to grow historically at 24.2%. However, its share price remains highly volatile and earnings have declined compared to last year’s figures, reflecting challenges in achieving consistent profitability amidst fluctuating sales performance.
- Click here to discover the nuances of Tarya Israel with our detailed analytical financial health report.
- Examine Tarya Israel's past performance report to understand how it has performed in prior years.
Where To Now?
- Unlock our comprehensive list of 80 Middle Eastern Penny Stocks by clicking here.
- Want To Explore Some Alternatives? Explore 26 top quantum computing companies leading the revolution in next-gen technology and shaping the future with breakthroughs in quantum algorithms, superconducting qubits, and cutting-edge research.
This article by Simply Wall St is general in nature. We provide commentary based on historical data and analyst forecasts only using an unbiased methodology and our articles are not intended to be financial advice. It does not constitute a recommendation to buy or sell any stock, and does not take account of your objectives, or your financial situation. We aim to bring you long-term focused analysis driven by fundamental data. Note that our analysis may not factor in the latest price-sensitive company announcements or qualitative material. Simply Wall St has no position in any stocks mentioned.
Valuation is complex, but we're here to simplify it.
Discover if Tarya Israel might be undervalued or overvalued with our detailed analysis, featuring fair value estimates, potential risks, dividends, insider trades, and its financial condition.
Access Free AnalysisHave feedback on this article? Concerned about the content? Get in touch with us directly. Alternatively, email editorial-team@simplywallst.com
About TASE:TRA
Excellent balance sheet with very low risk.
Market Insights

Advertisement
Community Narratives
MicroVision will explode future revenue by 380.37% with a vision towards success
Fair Value US$60.00|98.5% undervalued
TH
Community Contributor
The Indispensable Artery for a New North American Economy
Fair Value CA$132.87|2.3% undervalued
TI
Community Contributor