
Advertisement
- Singapore
- /
- Tech Hardware
- /
- SGX:5AB
Trek 2000 International Ltd's (SGX:5AB) 40% Share Price Surge Not Quite Adding Up
Trek 2000 International Ltd (SGX:5AB) shareholders would be excited to see that the share price has had a great month, posting a 40% gain and recovering from prior weakness. Notwithstanding the latest gain, the annual share price return of 2.9% isn't as impressive.
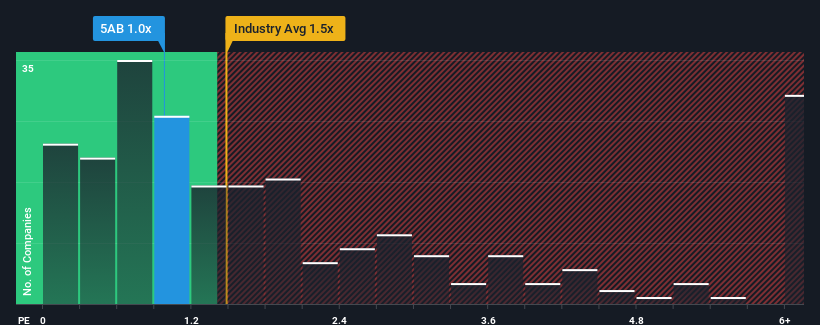
In spite of the firm bounce in price, it's still not a stretch to say that Trek 2000 International's price-to-sales (or "P/S") ratio of 1x right now seems quite "middle-of-the-road" compared to the Tech industry in Singapore, where the median P/S ratio is around 1.5x. However, investors might be overlooking a clear opportunity or potential setback if there is no rational basis for the P/S.
Check out our latest analysis for Trek 2000 International
How Trek 2000 International Has Been Performing
We'd have to say that with no tangible growth over the last year, Trek 2000 International's revenue has been unimpressive. One possibility is that the P/S is moderate because investors think this benign revenue growth rate might not be enough to outperform the broader industry in the near future. Those who are bullish on Trek 2000 International will be hoping that this isn't the case, so that they can pick up the stock at a lower valuation.
Want the full picture on earnings, revenue and cash flow for the company? Then our free report on Trek 2000 International will help you shine a light on its historical performance.Is There Some Revenue Growth Forecasted For Trek 2000 International?
Trek 2000 International's P/S ratio would be typical for a company that's only expected to deliver moderate growth, and importantly, perform in line with the industry.
Retrospectively, the last year delivered virtually the same number to the company's top line as the year before. Whilst it's an improvement, it wasn't enough to get the company out of the hole it was in, with revenue down 34% overall from three years ago. Therefore, it's fair to say the revenue growth recently has been undesirable for the company.
Weighing that medium-term revenue trajectory against the broader industry's one-year forecast for expansion of 16% shows it's an unpleasant look.
In light of this, it's somewhat alarming that Trek 2000 International's P/S sits in line with the majority of other companies. It seems most investors are ignoring the recent poor growth rate and are hoping for a turnaround in the company's business prospects. Only the boldest would assume these prices are sustainable as a continuation of recent revenue trends is likely to weigh on the share price eventually.
What We Can Learn From Trek 2000 International's P/S?
Trek 2000 International appears to be back in favour with a solid price jump bringing its P/S back in line with other companies in the industry Generally, our preference is to limit the use of the price-to-sales ratio to establishing what the market thinks about the overall health of a company.
The fact that Trek 2000 International currently trades at a P/S on par with the rest of the industry is surprising to us since its recent revenues have been in decline over the medium-term, all while the industry is set to grow. When we see revenue heading backwards in the context of growing industry forecasts, it'd make sense to expect a possible share price decline on the horizon, sending the moderate P/S lower. Unless the recent medium-term conditions improve markedly, investors will have a hard time accepting the share price as fair value.
Having said that, be aware Trek 2000 International is showing 3 warning signs in our investment analysis, and 1 of those is a bit concerning.
If you're unsure about the strength of Trek 2000 International's business, why not explore our interactive list of stocks with solid business fundamentals for some other companies you may have missed.
Valuation is complex, but we're here to simplify it.
Discover if Trek 2000 International might be undervalued or overvalued with our detailed analysis, featuring fair value estimates, potential risks, dividends, insider trades, and its financial condition.
Access Free AnalysisHave feedback on this article? Concerned about the content? Get in touch with us directly. Alternatively, email editorial-team (at) simplywallst.com.
This article by Simply Wall St is general in nature. We provide commentary based on historical data and analyst forecasts only using an unbiased methodology and our articles are not intended to be financial advice. It does not constitute a recommendation to buy or sell any stock, and does not take account of your objectives, or your financial situation. We aim to bring you long-term focused analysis driven by fundamental data. Note that our analysis may not factor in the latest price-sensitive company announcements or qualitative material. Simply Wall St has no position in any stocks mentioned.
About SGX:5AB
Trek 2000 International
An investment holding company, provides interactive consumer, wireless, encryption, and enterprise solutions.
Flawless balance sheet with slight risk.
Market Insights

Advertisement
Community Narratives
MicroVision will explode future revenue by 380.37% with a vision towards success
Fair Value US$60.00|98.4% undervalued
TH
Community Contributor
The Indispensable Artery for a New North American Economy
Fair Value CA$132.87|1.3% undervalued
TI
Community Contributor