Stock Analysis
- Singapore
- /
- Specialty Stores
- /
- SGX:5SO
Duty Free International's (SGX:5SO) earnings trajectory could turn positive as the stock soars 11% this past week

This week we saw the Duty Free International Limited (SGX:5SO) share price climb by 11%. But over the last half decade, the stock has not performed well. After all, the share price is down 52% in that time, significantly under-performing the market.
On a more encouraging note the company has added S$11m to its market cap in just the last 7 days, so let's see if we can determine what's driven the five-year loss for shareholders.
See our latest analysis for Duty Free International
In his essay The Superinvestors of Graham-and-Doddsville Warren Buffett described how share prices do not always rationally reflect the value of a business. One flawed but reasonable way to assess how sentiment around a company has changed is to compare the earnings per share (EPS) with the share price.
Duty Free International became profitable within the last five years. Most would consider that to be a good thing, so it's counter-intuitive to see the share price declining. Other metrics might give us a better handle on how its value is changing over time.
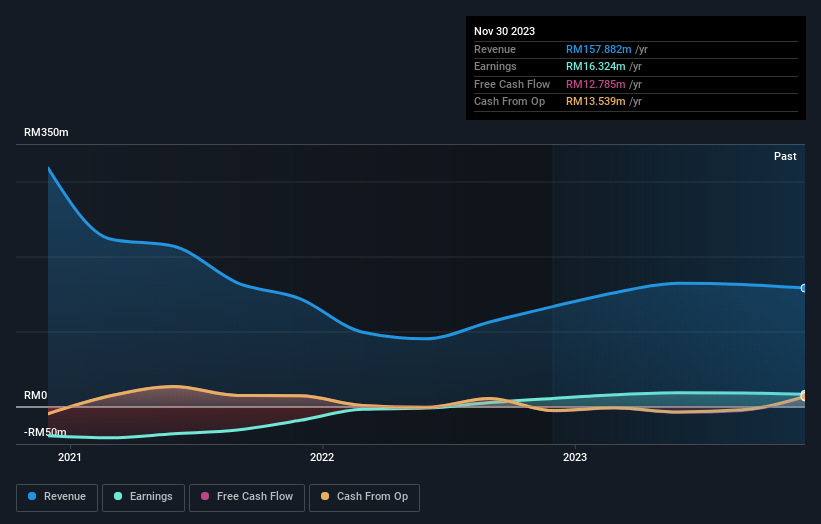
We don't think that the 1.7% is big factor in the share price, since it's quite small, as dividends go. Arguably, the revenue drop of 37% a year for half a decade suggests that the company can't grow in the long term. That could explain the weak share price.
The company's revenue and earnings (over time) are depicted in the image below (click to see the exact numbers).
Take a more thorough look at Duty Free International's financial health with this free report on its balance sheet.
What About Dividends?
It is important to consider the total shareholder return, as well as the share price return, for any given stock. The TSR is a return calculation that accounts for the value of cash dividends (assuming that any dividend received was reinvested) and the calculated value of any discounted capital raisings and spin-offs. It's fair to say that the TSR gives a more complete picture for stocks that pay a dividend. We note that for Duty Free International the TSR over the last 5 years was -31%, which is better than the share price return mentioned above. This is largely a result of its dividend payments!
A Different Perspective
Duty Free International shareholders are down 32% for the year (even including dividends), but the market itself is up 0.003%. However, keep in mind that even the best stocks will sometimes underperform the market over a twelve month period. Unfortunately, last year's performance may indicate unresolved challenges, given that it was worse than the annualised loss of 6% over the last half decade. Generally speaking long term share price weakness can be a bad sign, though contrarian investors might want to research the stock in hope of a turnaround. While it is well worth considering the different impacts that market conditions can have on the share price, there are other factors that are even more important. For instance, we've identified 2 warning signs for Duty Free International (1 shouldn't be ignored) that you should be aware of.
If you would prefer to check out another company -- one with potentially superior financials -- then do not miss this free list of companies that have proven they can grow earnings.
Please note, the market returns quoted in this article reflect the market weighted average returns of stocks that currently trade on Singaporean exchanges.
Valuation is complex, but we're helping make it simple.
Find out whether Duty Free International is potentially over or undervalued by checking out our comprehensive analysis, which includes fair value estimates, risks and warnings, dividends, insider transactions and financial health.
View the Free AnalysisHave feedback on this article? Concerned about the content? Get in touch with us directly. Alternatively, email editorial-team (at) simplywallst.com.
This article by Simply Wall St is general in nature. We provide commentary based on historical data and analyst forecasts only using an unbiased methodology and our articles are not intended to be financial advice. It does not constitute a recommendation to buy or sell any stock, and does not take account of your objectives, or your financial situation. We aim to bring you long-term focused analysis driven by fundamental data. Note that our analysis may not factor in the latest price-sensitive company announcements or qualitative material. Simply Wall St has no position in any stocks mentioned.
About SGX:5SO
Duty Free International
Duty Free International Limited, an investment holding company, trades in duty free merchandise under the Zon brand in Malaysia.
Flawless balance sheet unattractive dividend payer.

