
Advertisement
- Singapore
- /
- Industrial REITs
- /
- SGX:O5RU
If You Had Bought AIMS APAC REIT (SGX:O5RU) Shares A Year Ago You'd Have Earned 13% Returns
We believe investing is smart because history shows that stock markets go higher in the long term. But not every stock you buy will perform as well as the overall market. For example, the AIMS APAC REIT (SGX:O5RU), share price is up over the last year, but its gain of 13% trails the market return. Unfortunately the longer term returns are not so good, with the stock falling 5.1% in the last three years.
See our latest analysis for AIMS APAC REIT
While markets are a powerful pricing mechanism, share prices reflect investor sentiment, not just underlying business performance. One way to examine how market sentiment has changed over time is to look at the interaction between a company's share price and its earnings per share (EPS).
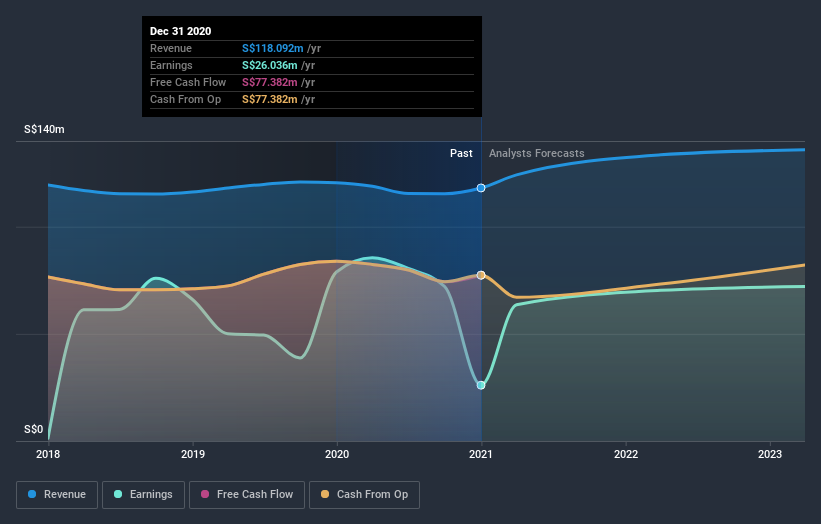
Over the last twelve months, AIMS APAC REIT actually shrank its EPS by 68%.
Given the share price gain, we doubt the market is measuring progress with EPS. Indeed, when EPS is declining but the share price is up, it often means the market is considering other factors.
We haven't seen AIMS APAC REIT increase dividend payments yet, so the yield probably hasn't helped drive the share higher. The slightly diminished revenue is not particularly impressive, at a glance, so that doesn't explain the share price boost.
The image below shows how earnings and revenue have tracked over time (if you click on the image you can see greater detail).
We know that AIMS APAC REIT has improved its bottom line over the last three years, but what does the future have in store? Take a more thorough look at AIMS APAC REIT's financial health with this free report on its balance sheet.
What About Dividends?
It is important to consider the total shareholder return, as well as the share price return, for any given stock. The TSR is a return calculation that accounts for the value of cash dividends (assuming that any dividend received was reinvested) and the calculated value of any discounted capital raisings and spin-offs. It's fair to say that the TSR gives a more complete picture for stocks that pay a dividend. In the case of AIMS APAC REIT, it has a TSR of 21% for the last year. That exceeds its share price return that we previously mentioned. And there's no prize for guessing that the dividend payments largely explain the divergence!
A Different Perspective
AIMS APAC REIT's TSR for the year was broadly in line with the market average, at 21%. Most would be happy with a gain, and it helps that the year's return is actually better than the average return over five years, which was 7%. It is possible that management foresight will bring growth well into the future, even if the share price slows down. It's always interesting to track share price performance over the longer term. But to understand AIMS APAC REIT better, we need to consider many other factors. Case in point: We've spotted 4 warning signs for AIMS APAC REIT you should be aware of, and 1 of them shouldn't be ignored.
Of course, you might find a fantastic investment by looking elsewhere. So take a peek at this free list of companies we expect will grow earnings.
Please note, the market returns quoted in this article reflect the market weighted average returns of stocks that currently trade on SG exchanges.
If you decide to trade AIMS APAC REIT, use the lowest-cost* platform that is rated #1 Overall by Barron’s, Interactive Brokers. Trade stocks, options, futures, forex, bonds and funds on 135 markets, all from a single integrated account. Promoted
New: Manage All Your Stock Portfolios in One Place
We've created the ultimate portfolio companion for stock investors, and it's free.
• Connect an unlimited number of Portfolios and see your total in one currency
• Be alerted to new Warning Signs or Risks via email or mobile
• Track the Fair Value of your stocks
This article by Simply Wall St is general in nature. It does not constitute a recommendation to buy or sell any stock, and does not take account of your objectives, or your financial situation. We aim to bring you long-term focused analysis driven by fundamental data. Note that our analysis may not factor in the latest price-sensitive company announcements or qualitative material. Simply Wall St has no position in any stocks mentioned.
*Interactive Brokers Rated Lowest Cost Broker by StockBrokers.com Annual Online Review 2020
Have feedback on this article? Concerned about the content? Get in touch with us directly. Alternatively, email editorial-team (at) simplywallst.com.
About SGX:O5RU
AIMS APAC REIT
Managed by the Manager, AIMS APAC REIT (“AA REIT”) is a real estate investment trust listed on the Mainboard of the SGX-ST since 2007.
Established dividend payer with adequate balance sheet.
Market Insights

Advertisement
Community Narratives
The company that turned a verb into a global necessity and basically runs the modern internet, digital ads, smartphones, maps, and AI.
Fair Value US$300.00|7.5% undervalued
OS
Community Contributor
Flowers Foods Pays A Fair Price For Health
Fair Value US$16.12|25.4% undervalued
NV
Community Contributor
TMX Group will thrive with 33.3% profit margin and enduring market moat
Fair Value CA$49.90|3.6% overvalued
LI
Community Contributor
The "Molecular Pencil": Why Beam's Technology is Built to Win
Fair Value US$65.01|65.0% undervalued
DA
Community Contributor