
Advertisement
Key Insights
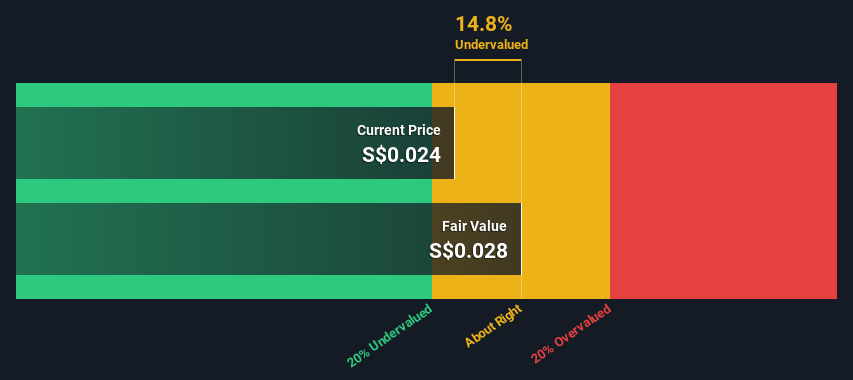
- Using the 2 Stage Free Cash Flow to Equity, Aspen (Group) Holdings fair value estimate is S$0.028
- Aspen (Group) Holdings' S$0.024 share price indicates it is trading at similar levels as its fair value estimate
- Industry average discount to fair value of 25% suggests Aspen (Group) Holdings' peers are currently trading at a higher discount
How far off is Aspen (Group) Holdings Limited (SGX:1F3) from its intrinsic value? Using the most recent financial data, we'll take a look at whether the stock is fairly priced by projecting its future cash flows and then discounting them to today's value. Our analysis will employ the Discounted Cash Flow (DCF) model. There's really not all that much to it, even though it might appear quite complex.
We would caution that there are many ways of valuing a company and, like the DCF, each technique has advantages and disadvantages in certain scenarios. If you still have some burning questions about this type of valuation, take a look at the Simply Wall St analysis model.
View our latest analysis for Aspen (Group) Holdings
The Method
We're using the 2-stage growth model, which simply means we take in account two stages of company's growth. In the initial period the company may have a higher growth rate and the second stage is usually assumed to have a stable growth rate. To begin with, we have to get estimates of the next ten years of cash flows. Seeing as no analyst estimates of free cash flow are available to us, we have extrapolate the previous free cash flow (FCF) from the company's last reported value. We assume companies with shrinking free cash flow will slow their rate of shrinkage, and that companies with growing free cash flow will see their growth rate slow, over this period. We do this to reflect that growth tends to slow more in the early years than it does in later years.
Generally we assume that a dollar today is more valuable than a dollar in the future, so we need to discount the sum of these future cash flows to arrive at a present value estimate:
10-year free cash flow (FCF) forecast
| 2024 | 2025 | 2026 | 2027 | 2028 | 2029 | 2030 | 2031 | 2032 | 2033 | |
| Levered FCF (MYR, Millions) | RM29.7m | RM21.0m | RM16.8m | RM14.6m | RM13.3m | RM12.6m | RM12.2m | RM12.0m | RM11.9m | RM11.9m |
| Growth Rate Estimate Source | Est @ -42.64% | Est @ -29.24% | Est @ -19.86% | Est @ -13.30% | Est @ -8.70% | Est @ -5.49% | Est @ -3.23% | Est @ -1.66% | Est @ -0.55% | Est @ 0.22% |
| Present Value (MYR, Millions) Discounted @ 16% | RM25.6 | RM15.7 | RM10.9 | RM8.2 | RM6.4 | RM5.3 | RM4.4 | RM3.7 | RM3.2 | RM2.8 |
("Est" = FCF growth rate estimated by Simply Wall St)
Present Value of 10-year Cash Flow (PVCF) = RM86m
After calculating the present value of future cash flows in the initial 10-year period, we need to calculate the Terminal Value, which accounts for all future cash flows beyond the first stage. The Gordon Growth formula is used to calculate Terminal Value at a future annual growth rate equal to the 5-year average of the 10-year government bond yield of 2.0%. We discount the terminal cash flows to today's value at a cost of equity of 16%.
Terminal Value (TV)= FCF2033 × (1 + g) ÷ (r – g) = RM12m× (1 + 2.0%) ÷ (16%– 2.0%) = RM89m
Present Value of Terminal Value (PVTV)= TV / (1 + r)10= RM89m÷ ( 1 + 16%)10= RM21m
The total value is the sum of cash flows for the next ten years plus the discounted terminal value, which results in the Total Equity Value, which in this case is RM107m. In the final step we divide the equity value by the number of shares outstanding. Compared to the current share price of S$0.02, the company appears about fair value at a 15% discount to where the stock price trades currently. Remember though, that this is just an approximate valuation, and like any complex formula - garbage in, garbage out.
The Assumptions
We would point out that the most important inputs to a discounted cash flow are the discount rate and of course the actual cash flows. Part of investing is coming up with your own evaluation of a company's future performance, so try the calculation yourself and check your own assumptions. The DCF also does not consider the possible cyclicality of an industry, or a company's future capital requirements, so it does not give a full picture of a company's potential performance. Given that we are looking at Aspen (Group) Holdings as potential shareholders, the cost of equity is used as the discount rate, rather than the cost of capital (or weighted average cost of capital, WACC) which accounts for debt. In this calculation we've used 16%, which is based on a levered beta of 2.000. Beta is a measure of a stock's volatility, compared to the market as a whole. We get our beta from the industry average beta of globally comparable companies, with an imposed limit between 0.8 and 2.0, which is a reasonable range for a stable business.
Next Steps:
Whilst important, the DCF calculation shouldn't be the only metric you look at when researching a company. The DCF model is not a perfect stock valuation tool. Rather it should be seen as a guide to "what assumptions need to be true for this stock to be under/overvalued?" For instance, if the terminal value growth rate is adjusted slightly, it can dramatically alter the overall result. For Aspen (Group) Holdings, there are three additional elements you should further examine:
- Risks: Consider for instance, the ever-present spectre of investment risk. We've identified 4 warning signs with Aspen (Group) Holdings (at least 2 which are concerning) , and understanding them should be part of your investment process.
- Other Solid Businesses: Low debt, high returns on equity and good past performance are fundamental to a strong business. Why not explore our interactive list of stocks with solid business fundamentals to see if there are other companies you may not have considered!
- Other Environmentally-Friendly Companies: Concerned about the environment and think consumers will buy eco-friendly products more and more? Browse through our interactive list of companies that are thinking about a greener future to discover some stocks you may not have thought of!
PS. The Simply Wall St app conducts a discounted cash flow valuation for every stock on the SGX every day. If you want to find the calculation for other stocks just search here.
New: Manage All Your Stock Portfolios in One Place
We've created the ultimate portfolio companion for stock investors, and it's free.
• Connect an unlimited number of Portfolios and see your total in one currency
• Be alerted to new Warning Signs or Risks via email or mobile
• Track the Fair Value of your stocks
Have feedback on this article? Concerned about the content? Get in touch with us directly. Alternatively, email editorial-team (at) simplywallst.com.
This article by Simply Wall St is general in nature. We provide commentary based on historical data and analyst forecasts only using an unbiased methodology and our articles are not intended to be financial advice. It does not constitute a recommendation to buy or sell any stock, and does not take account of your objectives, or your financial situation. We aim to bring you long-term focused analysis driven by fundamental data. Note that our analysis may not factor in the latest price-sensitive company announcements or qualitative material. Simply Wall St has no position in any stocks mentioned.
About SGX:1F3
Aspen (Group) Holdings
An investment holding company, engages in property development activities in Malaysia.
Adequate balance sheet and slightly overvalued.
Similar Companies
Market Insights

Advertisement
Community Narratives
MicroVision will explode future revenue by 380.37% with a vision towards success
Fair Value US$60|98.4% undervalued
TH
Community Contributor
The Indispensable Artery for a New North American Economy
Fair Value CA$132.87|1.6% undervalued
TI
Community Contributor
Recently Updated Narratives
BE


Bejgal on MINISO Group Holding ·
MINISO's fair value is projected at 26.69 with an anticipated PE ratio shift of 20x
Fair Value:US$26.6928.0% undervalued
44 followersusers have followed this narrative
3 commentsusers have commented on this narrative
0 likesusers have liked this narrative
TI


TickerTickle on Oracle ·
The Quiet Giant That Became AI’s Power Grid
Fair Value:US$389.8149.5% undervalued
7 followersusers have followed this narrative
1 commentusers have commented on this narrative
0 likesusers have liked this narrative
AU

AuCA on Nova Ljubljanska Banka d.d ·
Nova Ljubljanska Banka d.d will expect a 11.2% revenue boost driving future growth
Fair Value:€20916.3% undervalued
23 followersusers have followed this narrative
3 commentsusers have commented on this narrative
0 likesusers have liked this narrative
Popular Narratives
OS


oscargarcia on Alphabet ·
The company that turned a verb into a global necessity and basically runs the modern internet, digital ads, smartphones, maps, and AI.
Fair Value:US$3404.9% undervalued
135 followersusers have followed this narrative
6 commentsusers have commented on this narrative
18 likesusers have liked this narrative
TH

TheWallstreetKing on MicroVision ·
MicroVision will explode future revenue by 380.37% with a vision towards success
Fair Value:US$6098.4% undervalued
86 followersusers have followed this narrative
11 commentsusers have commented on this narrative
18 likesusers have liked this narrative
AN


AnalystConsensusTarget on NVIDIA ·
NVDA: Expanding AI Demand Will Drive Major Data Center Investments Through 2026
Fair Value:US$232.7923.6% undervalued
923 followersusers have followed this narrative
5 commentsusers have commented on this narrative
22 likesusers have liked this narrative