- Singapore
- /
- Healthcare Services
- /
- SGX:QC7
Q & M Dental Group (Singapore)'s (SGX:QC7) earnings trajectory could turn positive as the stock jumps 16% this past week


Q & M Dental Group (Singapore) Limited (SGX:QC7) shareholders should be happy to see the share price up 26% in the last quarter. But that is small recompense for the exasperating returns over three years. Regrettably, the share price slid 56% in that period. So it's good to see it climbing back up. Perhaps the company has turned over a new leaf.
Although the past week has been more reassuring for shareholders, they're still in the red over the last three years, so let's see if the underlying business has been responsible for the decline.
See our latest analysis for Q & M Dental Group (Singapore)
There is no denying that markets are sometimes efficient, but prices do not always reflect underlying business performance. One way to examine how market sentiment has changed over time is to look at the interaction between a company's share price and its earnings per share (EPS).
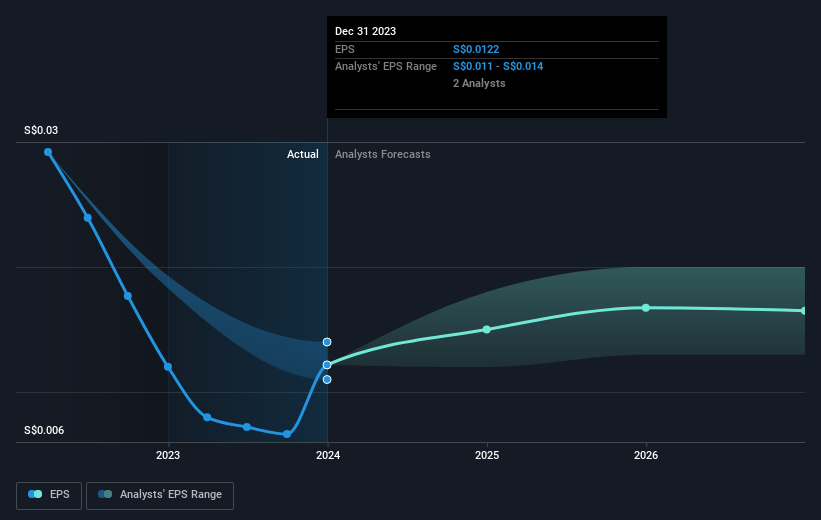
Q & M Dental Group (Singapore) saw its EPS decline at a compound rate of 16% per year, over the last three years. The share price decline of 24% is actually steeper than the EPS slippage. So it seems the market was too confident about the business, in the past.
The graphic below depicts how EPS has changed over time (unveil the exact values by clicking on the image).
This free interactive report on Q & M Dental Group (Singapore)'s earnings, revenue and cash flow is a great place to start, if you want to investigate the stock further.
What About Dividends?
As well as measuring the share price return, investors should also consider the total shareholder return (TSR). The TSR incorporates the value of any spin-offs or discounted capital raisings, along with any dividends, based on the assumption that the dividends are reinvested. It's fair to say that the TSR gives a more complete picture for stocks that pay a dividend. In the case of Q & M Dental Group (Singapore), it has a TSR of -52% for the last 3 years. That exceeds its share price return that we previously mentioned. This is largely a result of its dividend payments!
A Different Perspective
While the broader market gained around 8.1% in the last year, Q & M Dental Group (Singapore) shareholders lost 0.6% (even including dividends). Even the share prices of good stocks drop sometimes, but we want to see improvements in the fundamental metrics of a business, before getting too interested. However, the loss over the last year isn't as bad as the 2% per annum loss investors have suffered over the last half decade. We would want clear information suggesting the company will grow, before taking the view that the share price will stabilize. It's always interesting to track share price performance over the longer term. But to understand Q & M Dental Group (Singapore) better, we need to consider many other factors. Even so, be aware that Q & M Dental Group (Singapore) is showing 1 warning sign in our investment analysis , you should know about...
For those who like to find winning investments this free list of undervalued companies with recent insider purchasing, could be just the ticket.
Please note, the market returns quoted in this article reflect the market weighted average returns of stocks that currently trade on Singaporean exchanges.
Valuation is complex, but we're here to simplify it.
Discover if Q & M Dental Group (Singapore) might be undervalued or overvalued with our detailed analysis, featuring fair value estimates, potential risks, dividends, insider trades, and its financial condition.
Access Free AnalysisHave feedback on this article? Concerned about the content? Get in touch with us directly. Alternatively, email editorial-team (at) simplywallst.com.
This article by Simply Wall St is general in nature. We provide commentary based on historical data and analyst forecasts only using an unbiased methodology and our articles are not intended to be financial advice. It does not constitute a recommendation to buy or sell any stock, and does not take account of your objectives, or your financial situation. We aim to bring you long-term focused analysis driven by fundamental data. Note that our analysis may not factor in the latest price-sensitive company announcements or qualitative material. Simply Wall St has no position in any stocks mentioned.
Have feedback on this article? Concerned about the content? Get in touch with us directly. Alternatively, email editorial-team@simplywallst.com
About SGX:QC7
Q & M Dental Group (Singapore)
An investment holding company, provides private dental healthcare services in Singapore, Malaysia, China, and internationally.
Very undervalued with proven track record.

