
Advertisement
The external fund manager backed by Berkshire Hathaway's Charlie Munger, Li Lu, makes no bones about it when he says 'The biggest investment risk is not the volatility of prices, but whether you will suffer a permanent loss of capital.' So it seems the smart money knows that debt - which is usually involved in bankruptcies - is a very important factor, when you assess how risky a company is. As with many other companies AMOS Group Limited (SGX:49B) makes use of debt. But the real question is whether this debt is making the company risky.
When Is Debt A Problem?
Debt assists a business until the business has trouble paying it off, either with new capital or with free cash flow. In the worst case scenario, a company can go bankrupt if it cannot pay its creditors. However, a more frequent (but still costly) occurrence is where a company must issue shares at bargain-basement prices, permanently diluting shareholders, just to shore up its balance sheet. Of course, the upside of debt is that it often represents cheap capital, especially when it replaces dilution in a company with the ability to reinvest at high rates of return. The first step when considering a company's debt levels is to consider its cash and debt together.
Check out our latest analysis for AMOS Group
What Is AMOS Group's Net Debt?
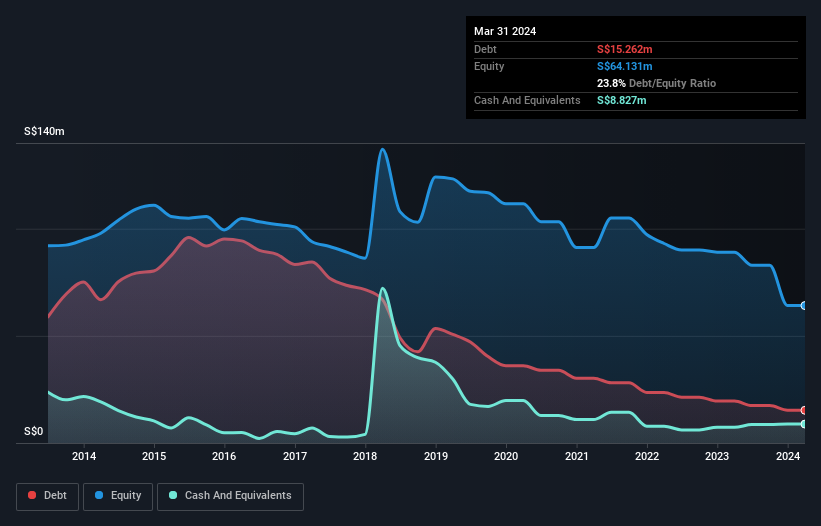
The image below, which you can click on for greater detail, shows that AMOS Group had debt of S$15.3m at the end of March 2024, a reduction from S$19.6m over a year. On the flip side, it has S$8.83m in cash leading to net debt of about S$6.44m.
How Healthy Is AMOS Group's Balance Sheet?
Zooming in on the latest balance sheet data, we can see that AMOS Group had liabilities of S$40.1m due within 12 months and liabilities of S$9.72m due beyond that. Offsetting these obligations, it had cash of S$8.83m as well as receivables valued at S$20.0m due within 12 months. So it has liabilities totalling S$21.0m more than its cash and near-term receivables, combined.
This deficit casts a shadow over the S$9.37m company, like a colossus towering over mere mortals. So we definitely think shareholders need to watch this one closely. After all, AMOS Group would likely require a major re-capitalisation if it had to pay its creditors today. The balance sheet is clearly the area to focus on when you are analysing debt. But it is AMOS Group's earnings that will influence how the balance sheet holds up in the future. So if you're keen to discover more about its earnings, it might be worth checking out this graph of its long term earnings trend.
Over 12 months, AMOS Group made a loss at the EBIT level, and saw its revenue drop to S$74m, which is a fall of 25%. That makes us nervous, to say the least.
Caveat Emptor
Not only did AMOS Group's revenue slip over the last twelve months, but it also produced negative earnings before interest and tax (EBIT). Its EBIT loss was a whopping S$23m. When we look at that alongside the significant liabilities, we're not particularly confident about the company. It would need to improve its operations quickly for us to be interested in it. It's fair to say the loss of S$24m didn't encourage us either; we'd like to see a profit. In the meantime, we consider the stock to be risky. When analysing debt levels, the balance sheet is the obvious place to start. But ultimately, every company can contain risks that exist outside of the balance sheet. We've identified 2 warning signs with AMOS Group , and understanding them should be part of your investment process.
Of course, if you're the type of investor who prefers buying stocks without the burden of debt, then don't hesitate to discover our exclusive list of net cash growth stocks, today.
New: Manage All Your Stock Portfolios in One Place
We've created the ultimate portfolio companion for stock investors, and it's free.
• Connect an unlimited number of Portfolios and see your total in one currency
• Be alerted to new Warning Signs or Risks via email or mobile
• Track the Fair Value of your stocks
Have feedback on this article? Concerned about the content? Get in touch with us directly. Alternatively, email editorial-team (at) simplywallst.com.
This article by Simply Wall St is general in nature. We provide commentary based on historical data and analyst forecasts only using an unbiased methodology and our articles are not intended to be financial advice. It does not constitute a recommendation to buy or sell any stock, and does not take account of your objectives, or your financial situation. We aim to bring you long-term focused analysis driven by fundamental data. Note that our analysis may not factor in the latest price-sensitive company announcements or qualitative material. Simply Wall St has no position in any stocks mentioned.
About SGX:49B
AMOS Group
An investment holding company, manufactures and supplies rigging and lifting equipment for offshore oil and gas, and marine industries worldwide.
Flawless balance sheet and slightly overvalued.
Market Insights

Advertisement
Community Narratives
MicroVision will explode future revenue by 380.37% with a vision towards success
Fair Value US$60.00|98.4% undervalued
TH
Community Contributor
The Indispensable Artery for a New North American Economy
Fair Value CA$132.87|1.3% undervalued
TI
Community Contributor