
Advertisement
The external fund manager backed by Berkshire Hathaway's Charlie Munger, Li Lu, makes no bones about it when he says 'The biggest investment risk is not the volatility of prices, but whether you will suffer a permanent loss of capital.' So it seems the smart money knows that debt - which is usually involved in bankruptcies - is a very important factor, when you assess how risky a company is. Importantly, AMOS Group Limited (SGX:49B) does carry debt. But the more important question is: how much risk is that debt creating?
Why Does Debt Bring Risk?
Debt is a tool to help businesses grow, but if a business is incapable of paying off its lenders, then it exists at their mercy. Ultimately, if the company can't fulfill its legal obligations to repay debt, shareholders could walk away with nothing. However, a more usual (but still expensive) situation is where a company must dilute shareholders at a cheap share price simply to get debt under control. By replacing dilution, though, debt can be an extremely good tool for businesses that need capital to invest in growth at high rates of return. When we examine debt levels, we first consider both cash and debt levels, together.
Check out our latest analysis for AMOS Group
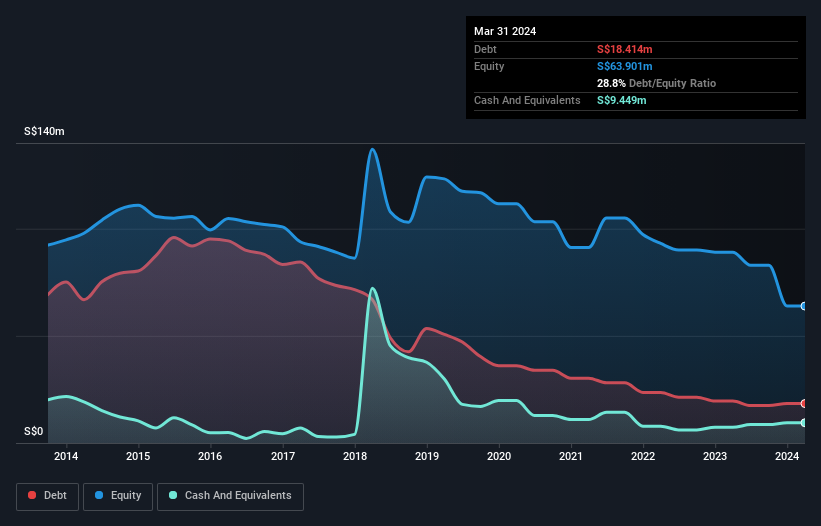
What Is AMOS Group's Net Debt?
The image below, which you can click on for greater detail, shows that AMOS Group had debt of S$18.4m at the end of March 2024, a reduction from S$19.6m over a year. However, because it has a cash reserve of S$9.45m, its net debt is less, at about S$8.97m.
A Look At AMOS Group's Liabilities
We can see from the most recent balance sheet that AMOS Group had liabilities of S$40.1m falling due within a year, and liabilities of S$9.75m due beyond that. On the other hand, it had cash of S$9.45m and S$17.6m worth of receivables due within a year. So it has liabilities totalling S$22.7m more than its cash and near-term receivables, combined.
This deficit casts a shadow over the S$9.17m company, like a colossus towering over mere mortals. So we'd watch its balance sheet closely, without a doubt. After all, AMOS Group would likely require a major re-capitalisation if it had to pay its creditors today. There's no doubt that we learn most about debt from the balance sheet. But it is AMOS Group's earnings that will influence how the balance sheet holds up in the future. So if you're keen to discover more about its earnings, it might be worth checking out this graph of its long term earnings trend.
In the last year AMOS Group had a loss before interest and tax, and actually shrunk its revenue by 25%, to S$74m. To be frank that doesn't bode well.
Caveat Emptor
Not only did AMOS Group's revenue slip over the last twelve months, but it also produced negative earnings before interest and tax (EBIT). Indeed, it lost a very considerable S$12m at the EBIT level. When we look at that alongside the significant liabilities, we're not particularly confident about the company. It would need to improve its operations quickly for us to be interested in it. It's fair to say the loss of S$25m didn't encourage us either; we'd like to see a profit. And until that time we think this is a risky stock. When analysing debt levels, the balance sheet is the obvious place to start. But ultimately, every company can contain risks that exist outside of the balance sheet. These risks can be hard to spot. Every company has them, and we've spotted 2 warning signs for AMOS Group you should know about.
Of course, if you're the type of investor who prefers buying stocks without the burden of debt, then don't hesitate to discover our exclusive list of net cash growth stocks, today.
New: Manage All Your Stock Portfolios in One Place
We've created the ultimate portfolio companion for stock investors, and it's free.
• Connect an unlimited number of Portfolios and see your total in one currency
• Be alerted to new Warning Signs or Risks via email or mobile
• Track the Fair Value of your stocks
Have feedback on this article? Concerned about the content? Get in touch with us directly. Alternatively, email editorial-team (at) simplywallst.com.
This article by Simply Wall St is general in nature. We provide commentary based on historical data and analyst forecasts only using an unbiased methodology and our articles are not intended to be financial advice. It does not constitute a recommendation to buy or sell any stock, and does not take account of your objectives, or your financial situation. We aim to bring you long-term focused analysis driven by fundamental data. Note that our analysis may not factor in the latest price-sensitive company announcements or qualitative material. Simply Wall St has no position in any stocks mentioned.
About SGX:49B
AMOS Group
An investment holding company, manufactures and supplies rigging and lifting equipment for offshore oil and gas, and marine industries worldwide.
Flawless balance sheet and slightly overvalued.
Market Insights

Advertisement
Community Narratives
MicroVision will explode future revenue by 380.37% with a vision towards success
Fair Value US$60.00|98.4% undervalued
TH
Community Contributor
The Indispensable Artery for a New North American Economy
Fair Value CA$132.87|1.3% undervalued
TI
Community Contributor