
Advertisement
- Singapore
- /
- Construction
- /
- SGX:MF6
There's Reason For Concern Over Mun Siong Engineering Limited's (SGX:MF6) Massive 43% Price Jump
Mun Siong Engineering Limited (SGX:MF6) shares have continued their recent momentum with a 43% gain in the last month alone. While recent buyers may be laughing, long-term holders might not be as pleased since the recent gain only brings the stock back to where it started a year ago.
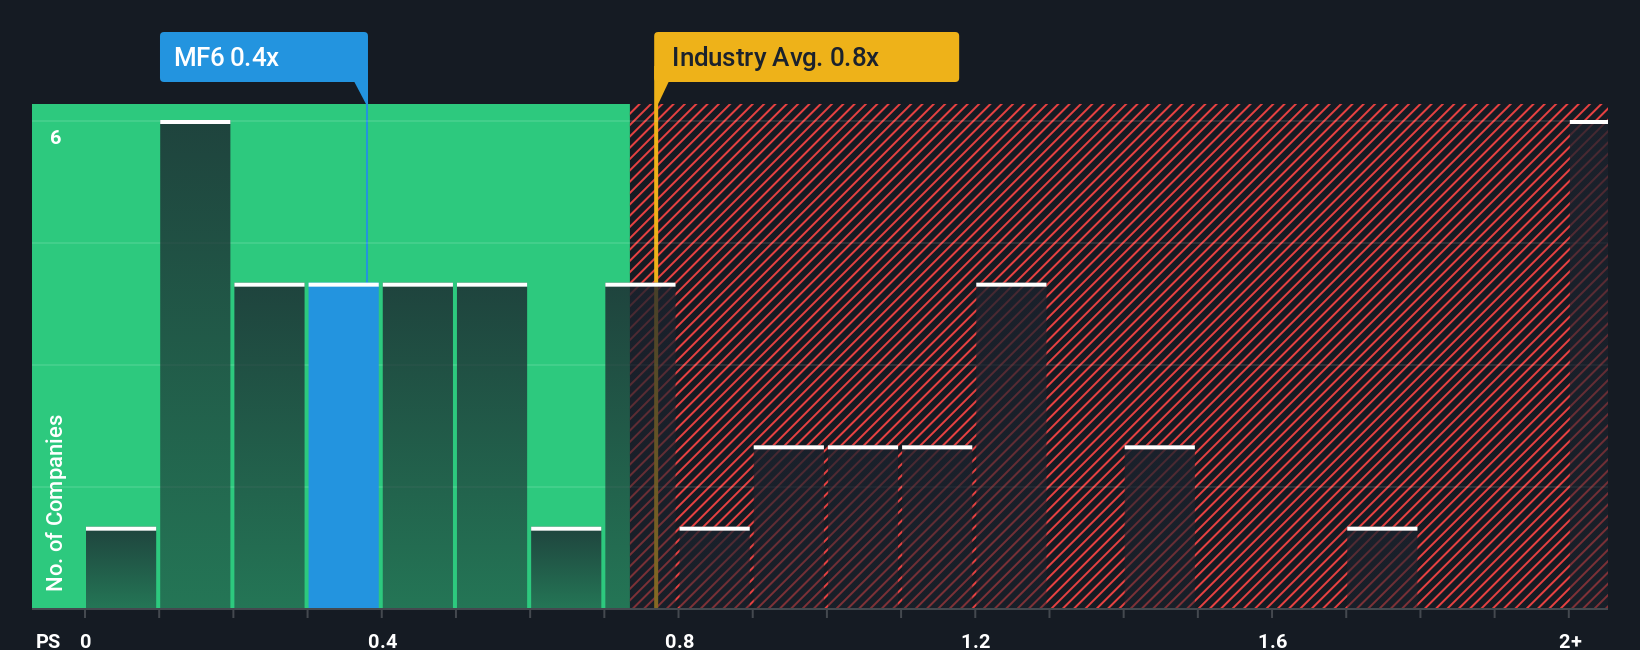
Even after such a large jump in price, there still wouldn't be many who think Mun Siong Engineering's price-to-sales (or "P/S") ratio of 0.4x is worth a mention when the median P/S in Singapore's Construction industry is similar at about 0.8x. Although, it's not wise to simply ignore the P/S without explanation as investors may be disregarding a distinct opportunity or a costly mistake.
See our latest analysis for Mun Siong Engineering
What Does Mun Siong Engineering's Recent Performance Look Like?
For example, consider that Mun Siong Engineering's financial performance has been poor lately as its revenue has been in decline. It might be that many expect the company to put the disappointing revenue performance behind them over the coming period, which has kept the P/S from falling. If not, then existing shareholders may be a little nervous about the viability of the share price.
Want the full picture on earnings, revenue and cash flow for the company? Then our free report on Mun Siong Engineering will help you shine a light on its historical performance.How Is Mun Siong Engineering's Revenue Growth Trending?
In order to justify its P/S ratio, Mun Siong Engineering would need to produce growth that's similar to the industry.
Taking a look back first, the company's revenue growth last year wasn't something to get excited about as it posted a disappointing decline of 2.5%. As a result, revenue from three years ago have also fallen 11% overall. Therefore, it's fair to say the revenue growth recently has been undesirable for the company.
Weighing that medium-term revenue trajectory against the broader industry's one-year forecast for expansion of 22% shows it's an unpleasant look.
With this information, we find it concerning that Mun Siong Engineering is trading at a fairly similar P/S compared to the industry. Apparently many investors in the company are way less bearish than recent times would indicate and aren't willing to let go of their stock right now. Only the boldest would assume these prices are sustainable as a continuation of recent revenue trends is likely to weigh on the share price eventually.
The Bottom Line On Mun Siong Engineering's P/S
Its shares have lifted substantially and now Mun Siong Engineering's P/S is back within range of the industry median. Generally, our preference is to limit the use of the price-to-sales ratio to establishing what the market thinks about the overall health of a company.
We find it unexpected that Mun Siong Engineering trades at a P/S ratio that is comparable to the rest of the industry, despite experiencing declining revenues during the medium-term, while the industry as a whole is expected to grow. Even though it matches the industry, we're uncomfortable with the current P/S ratio, as this dismal revenue performance is unlikely to support a more positive sentiment for long. If recent medium-term revenue trends continue, it will place shareholders' investments at risk and potential investors in danger of paying an unnecessary premium.
You need to take note of risks, for example - Mun Siong Engineering has 3 warning signs (and 2 which are significant) we think you should know about.
If these risks are making you reconsider your opinion on Mun Siong Engineering, explore our interactive list of high quality stocks to get an idea of what else is out there.
New: Manage All Your Stock Portfolios in One Place
We've created the ultimate portfolio companion for stock investors, and it's free.
• Connect an unlimited number of Portfolios and see your total in one currency
• Be alerted to new Warning Signs or Risks via email or mobile
• Track the Fair Value of your stocks
Have feedback on this article? Concerned about the content? Get in touch with us directly. Alternatively, email editorial-team (at) simplywallst.com.
This article by Simply Wall St is general in nature. We provide commentary based on historical data and analyst forecasts only using an unbiased methodology and our articles are not intended to be financial advice. It does not constitute a recommendation to buy or sell any stock, and does not take account of your objectives, or your financial situation. We aim to bring you long-term focused analysis driven by fundamental data. Note that our analysis may not factor in the latest price-sensitive company announcements or qualitative material. Simply Wall St has no position in any stocks mentioned.
About SGX:MF6
Mun Siong Engineering
Provides mechanical and electrical engineering services for the oil and gas, process, petrochemical, energy, chemical, power, and pharmaceutical industries worldwide.
Mediocre balance sheet with low risk.
Market Insights

Advertisement
Community Narratives
The company that turned a verb into a global necessity and basically runs the modern internet, digital ads, smartphones, maps, and AI.
Fair Value US$300.00|5.4% undervalued
OS
Community Contributor
Flowers Foods Pays A Fair Price For Health
Fair Value US$16.12|26.3% undervalued
NV
Community Contributor
TMX Group will thrive with 33.3% profit margin and enduring market moat
Fair Value CA$49.90|4.1% overvalued
LI
Community Contributor