
Advertisement
Does Mycronic (STO:MYCR) Have A Healthy Balance Sheet?
Warren Buffett famously said, 'Volatility is far from synonymous with risk.' It's only natural to consider a company's balance sheet when you examine how risky it is, since debt is often involved when a business collapses. As with many other companies Mycronic AB (publ) (STO:MYCR) makes use of debt. But should shareholders be worried about its use of debt?
Why Does Debt Bring Risk?
Debt and other liabilities become risky for a business when it cannot easily fulfill those obligations, either with free cash flow or by raising capital at an attractive price. Part and parcel of capitalism is the process of 'creative destruction' where failed businesses are mercilessly liquidated by their bankers. However, a more usual (but still expensive) situation is where a company must dilute shareholders at a cheap share price simply to get debt under control. Of course, the upside of debt is that it often represents cheap capital, especially when it replaces dilution in a company with the ability to reinvest at high rates of return. The first step when considering a company's debt levels is to consider its cash and debt together.
How Much Debt Does Mycronic Carry?
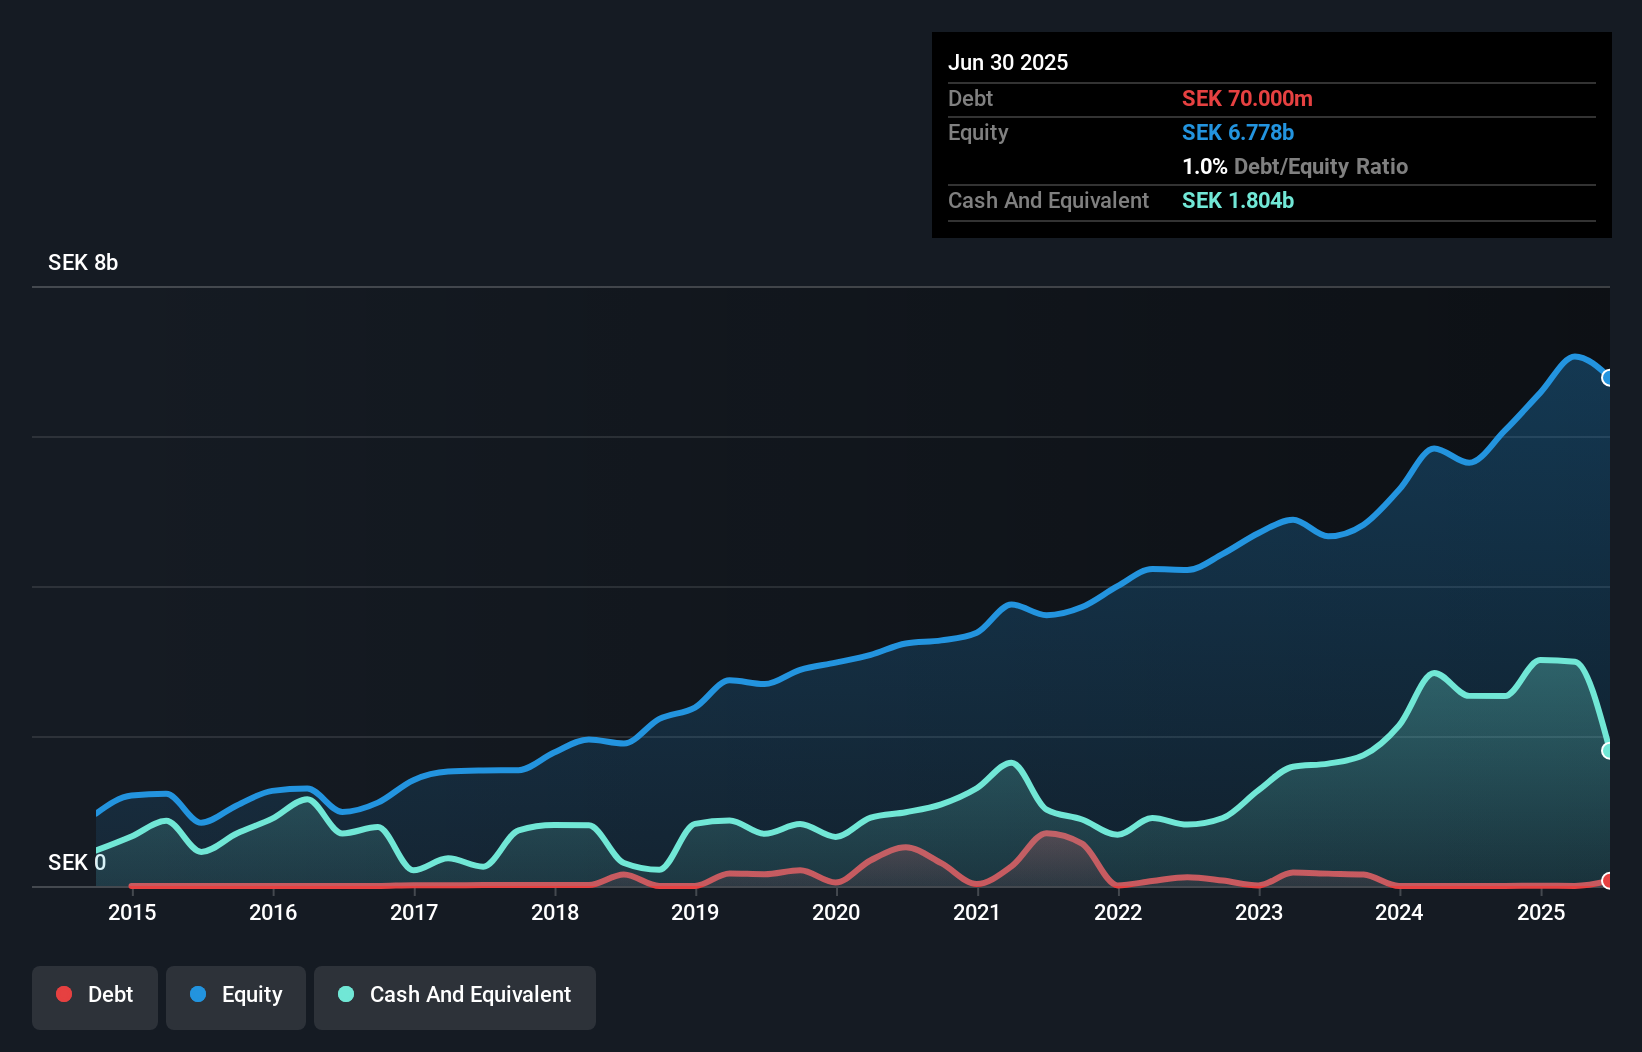
As you can see below, at the end of June 2025, Mycronic had kr70.0m of debt, up from none a year ago. Click the image for more detail. But on the other hand it also has kr1.80b in cash, leading to a kr1.73b net cash position.
How Strong Is Mycronic's Balance Sheet?
The latest balance sheet data shows that Mycronic had liabilities of kr2.73b due within a year, and liabilities of kr846.0m falling due after that. On the other hand, it had cash of kr1.80b and kr1.94b worth of receivables due within a year. So it can boast kr177.0m more liquid assets than total liabilities.
Having regard to Mycronic's size, it seems that its liquid assets are well balanced with its total liabilities. So it's very unlikely that the kr42.3b company is short on cash, but still worth keeping an eye on the balance sheet. Succinctly put, Mycronic boasts net cash, so it's fair to say it does not have a heavy debt load!
Check out our latest analysis for Mycronic
On top of that, Mycronic grew its EBIT by 30% over the last twelve months, and that growth will make it easier to handle its debt. There's no doubt that we learn most about debt from the balance sheet. But it is future earnings, more than anything, that will determine Mycronic's ability to maintain a healthy balance sheet going forward. So if you want to see what the professionals think, you might find this free report on analyst profit forecasts to be interesting.
Finally, while the tax-man may adore accounting profits, lenders only accept cold hard cash. Mycronic may have net cash on the balance sheet, but it is still interesting to look at how well the business converts its earnings before interest and tax (EBIT) to free cash flow, because that will influence both its need for, and its capacity to manage debt. Over the last three years, Mycronic recorded free cash flow worth a fulsome 84% of its EBIT, which is stronger than we'd usually expect. That puts it in a very strong position to pay down debt.
Summing Up
While we empathize with investors who find debt concerning, you should keep in mind that Mycronic has net cash of kr1.73b, as well as more liquid assets than liabilities. And it impressed us with free cash flow of kr1.2b, being 84% of its EBIT. So is Mycronic's debt a risk? It doesn't seem so to us. When analysing debt levels, the balance sheet is the obvious place to start. However, not all investment risk resides within the balance sheet - far from it. Case in point: We've spotted 1 warning sign for Mycronic you should be aware of.
Of course, if you're the type of investor who prefers buying stocks without the burden of debt, then don't hesitate to discover our exclusive list of net cash growth stocks, today.
New: Manage All Your Stock Portfolios in One Place
We've created the ultimate portfolio companion for stock investors, and it's free.
• Connect an unlimited number of Portfolios and see your total in one currency
• Be alerted to new Warning Signs or Risks via email or mobile
• Track the Fair Value of your stocks
Have feedback on this article? Concerned about the content? Get in touch with us directly. Alternatively, email editorial-team (at) simplywallst.com.
This article by Simply Wall St is general in nature. We provide commentary based on historical data and analyst forecasts only using an unbiased methodology and our articles are not intended to be financial advice. It does not constitute a recommendation to buy or sell any stock, and does not take account of your objectives, or your financial situation. We aim to bring you long-term focused analysis driven by fundamental data. Note that our analysis may not factor in the latest price-sensitive company announcements or qualitative material. Simply Wall St has no position in any stocks mentioned.
About OM:MYCR
Mycronic
Develops, manufactures, and sells production equipment for electronics industry in Sweden, rest of Europe, the United States, other Americas, China, South Korea, rest of Asia, and internationally.
Flawless balance sheet and good value.
Similar Companies
Market Insights

Advertisement
Community Narratives
MicroVision will explode future revenue by 380.37% with a vision towards success
Fair Value US$60.00|98.4% undervalued
TH
Community Contributor
The Indispensable Artery for a New North American Economy
Fair Value CA$132.87|1.3% undervalued
TI
Community Contributor