The total return for Ependion (STO:EPEN) investors has risen faster than earnings growth over the last three years


Ependion AB (STO:EPEN) shareholders might be concerned after seeing the share price drop 17% in the last month. But that doesn't undermine the rather lovely longer-term return, if you measure over the last three years. Indeed, the share price is up a very strong 234% in that time. It's not uncommon to see a share price retrace a bit, after a big gain. Only time will tell if there is still too much optimism currently reflected in the share price.
Although Ependion has shed kr475m from its market cap this week, let's take a look at its longer term fundamental trends and see if they've driven returns.
Check out our latest analysis for Ependion
To quote Buffett, 'Ships will sail around the world but the Flat Earth Society will flourish. There will continue to be wide discrepancies between price and value in the marketplace...' By comparing earnings per share (EPS) and share price changes over time, we can get a feel for how investor attitudes to a company have morphed over time.
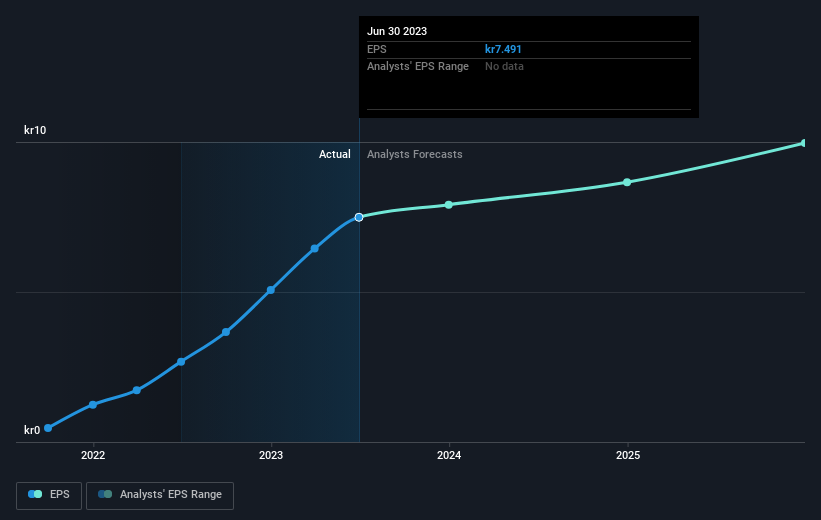
Ependion was able to grow its EPS at 81% per year over three years, sending the share price higher. The average annual share price increase of 49% is actually lower than the EPS growth. So it seems investors have become more cautious about the company, over time.
The image below shows how EPS has tracked over time (if you click on the image you can see greater detail).
We know that Ependion has improved its bottom line over the last three years, but what does the future have in store? If you are thinking of buying or selling Ependion stock, you should check out this FREE detailed report on its balance sheet.
What About Dividends?
As well as measuring the share price return, investors should also consider the total shareholder return (TSR). The TSR incorporates the value of any spin-offs or discounted capital raisings, along with any dividends, based on the assumption that the dividends are reinvested. So for companies that pay a generous dividend, the TSR is often a lot higher than the share price return. In the case of Ependion, it has a TSR of 238% for the last 3 years. That exceeds its share price return that we previously mentioned. And there's no prize for guessing that the dividend payments largely explain the divergence!
A Different Perspective
It's good to see that Ependion has rewarded shareholders with a total shareholder return of 101% in the last twelve months. That's including the dividend. That gain is better than the annual TSR over five years, which is 25%. Therefore it seems like sentiment around the company has been positive lately. Given the share price momentum remains strong, it might be worth taking a closer look at the stock, lest you miss an opportunity. While it is well worth considering the different impacts that market conditions can have on the share price, there are other factors that are even more important. Case in point: We've spotted 1 warning sign for Ependion you should be aware of.
If you would prefer to check out another company -- one with potentially superior financials -- then do not miss this free list of companies that have proven they can grow earnings.
Please note, the market returns quoted in this article reflect the market weighted average returns of stocks that currently trade on Swedish exchanges.
Valuation is complex, but we're here to simplify it.
Discover if Ependion might be undervalued or overvalued with our detailed analysis, featuring fair value estimates, potential risks, dividends, insider trades, and its financial condition.
Access Free AnalysisHave feedback on this article? Concerned about the content? Get in touch with us directly. Alternatively, email editorial-team (at) simplywallst.com.
This article by Simply Wall St is general in nature. We provide commentary based on historical data and analyst forecasts only using an unbiased methodology and our articles are not intended to be financial advice. It does not constitute a recommendation to buy or sell any stock, and does not take account of your objectives, or your financial situation. We aim to bring you long-term focused analysis driven by fundamental data. Note that our analysis may not factor in the latest price-sensitive company announcements or qualitative material. Simply Wall St has no position in any stocks mentioned.
About OM:EPEN
Ependion
Provides digital solutions for secure control, management, visualization, and data communication.
Undervalued with adequate balance sheet.
