
Advertisement
Health Check: How Prudently Does Sustainion Group (NGM:SUSG) Use Debt?
Some say volatility, rather than debt, is the best way to think about risk as an investor, but Warren Buffett famously said that 'Volatility is far from synonymous with risk.' It's only natural to consider a company's balance sheet when you examine how risky it is, since debt is often involved when a business collapses. We can see that Sustainion Group AB (NGM:SUSG) does use debt in its business. But is this debt a concern to shareholders?
What Risk Does Debt Bring?
Debt and other liabilities become risky for a business when it cannot easily fulfill those obligations, either with free cash flow or by raising capital at an attractive price. If things get really bad, the lenders can take control of the business. However, a more frequent (but still costly) occurrence is where a company must issue shares at bargain-basement prices, permanently diluting shareholders, just to shore up its balance sheet. By replacing dilution, though, debt can be an extremely good tool for businesses that need capital to invest in growth at high rates of return. The first thing to do when considering how much debt a business uses is to look at its cash and debt together.
See our latest analysis for Sustainion Group
What Is Sustainion Group's Debt?
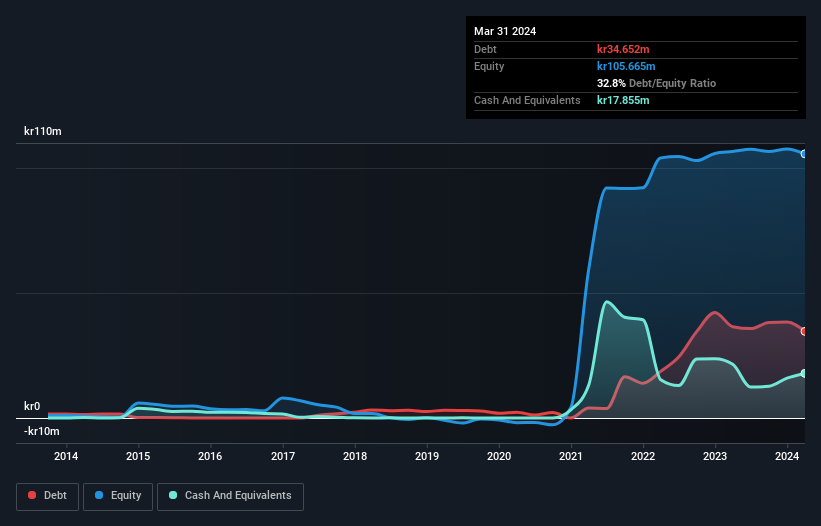
As you can see below, Sustainion Group had kr34.7m of debt at March 2024, down from kr36.5m a year prior. However, it does have kr17.9m in cash offsetting this, leading to net debt of about kr16.8m.
A Look At Sustainion Group's Liabilities
We can see from the most recent balance sheet that Sustainion Group had liabilities of kr69.6m falling due within a year, and liabilities of kr70.1m due beyond that. Offsetting these obligations, it had cash of kr17.9m as well as receivables valued at kr32.1m due within 12 months. So its liabilities total kr89.8m more than the combination of its cash and short-term receivables.
Given this deficit is actually higher than the company's market capitalization of kr82.8m, we think shareholders really should watch Sustainion Group's debt levels, like a parent watching their child ride a bike for the first time. In the scenario where the company had to clean up its balance sheet quickly, it seems likely shareholders would suffer extensive dilution. When analysing debt levels, the balance sheet is the obvious place to start. But it is Sustainion Group's earnings that will influence how the balance sheet holds up in the future. So if you're keen to discover more about its earnings, it might be worth checking out this graph of its long term earnings trend.
In the last year Sustainion Group's revenue was pretty flat, and it made a negative EBIT. While that's not too bad, we'd prefer see growth.
Caveat Emptor
Over the last twelve months Sustainion Group produced an earnings before interest and tax (EBIT) loss. To be specific the EBIT loss came in at kr431k. Considering that alongside the liabilities mentioned above make us nervous about the company. We'd want to see some strong near-term improvements before getting too interested in the stock. For example, we would not want to see a repeat of last year's loss of kr847k. In the meantime, we consider the stock to be risky. There's no doubt that we learn most about debt from the balance sheet. But ultimately, every company can contain risks that exist outside of the balance sheet. These risks can be hard to spot. Every company has them, and we've spotted 2 warning signs for Sustainion Group (of which 1 doesn't sit too well with us!) you should know about.
At the end of the day, it's often better to focus on companies that are free from net debt. You can access our special list of such companies (all with a track record of profit growth). It's free.
New: Manage All Your Stock Portfolios in One Place
We've created the ultimate portfolio companion for stock investors, and it's free.
• Connect an unlimited number of Portfolios and see your total in one currency
• Be alerted to new Warning Signs or Risks via email or mobile
• Track the Fair Value of your stocks
Have feedback on this article? Concerned about the content? Get in touch with us directly. Alternatively, email editorial-team (at) simplywallst.com.
This article by Simply Wall St is general in nature. We provide commentary based on historical data and analyst forecasts only using an unbiased methodology and our articles are not intended to be financial advice. It does not constitute a recommendation to buy or sell any stock, and does not take account of your objectives, or your financial situation. We aim to bring you long-term focused analysis driven by fundamental data. Note that our analysis may not factor in the latest price-sensitive company announcements or qualitative material. Simply Wall St has no position in any stocks mentioned.
Have feedback on this article? Concerned about the content? Get in touch with us directly. Alternatively, email editorial-team@simplywallst.com
About NGM:SUSG
Sustainion Group
Through its subsidiaries, develops and sells security products in Sweden.
Adequate balance sheet slight.
Market Insights

Advertisement
Community Narratives
MicroVision will explode future revenue by 380.37% with a vision towards success
Fair Value US$60.00|98.4% undervalued
TH
Community Contributor
The Indispensable Artery for a New North American Economy
Fair Value CA$132.87|1.3% undervalued
TI
Community Contributor