
Advertisement
Estimating The Intrinsic Value Of Sustainion Group AB (NGM:SUSG)
Key Insights
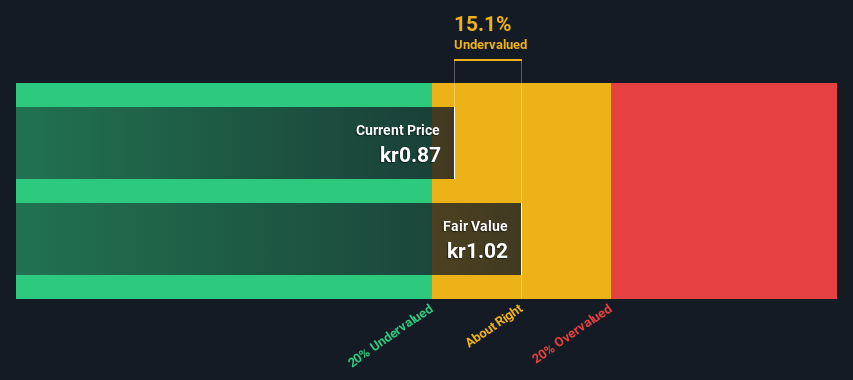
- The projected fair value for Sustainion Group is kr1.02 based on 2 Stage Free Cash Flow to Equity
- Current share price of kr0.87 suggests Sustainion Group is potentially trading close to its fair value
- Peers of Sustainion Group are currently trading on average at a 61% premium
Does the June share price for Sustainion Group AB (NGM:SUSG) reflect what it's really worth? Today, we will estimate the stock's intrinsic value by taking the forecast future cash flows of the company and discounting them back to today's value. Our analysis will employ the Discounted Cash Flow (DCF) model. Before you think you won't be able to understand it, just read on! It's actually much less complex than you'd imagine.
We generally believe that a company's value is the present value of all of the cash it will generate in the future. However, a DCF is just one valuation metric among many, and it is not without flaws. Anyone interested in learning a bit more about intrinsic value should have a read of the Simply Wall St analysis model.
See our latest analysis for Sustainion Group
Is Sustainion Group Fairly Valued?
We are going to use a two-stage DCF model, which, as the name states, takes into account two stages of growth. The first stage is generally a higher growth period which levels off heading towards the terminal value, captured in the second 'steady growth' period. To start off with, we need to estimate the next ten years of cash flows. Seeing as no analyst estimates of free cash flow are available to us, we have extrapolate the previous free cash flow (FCF) from the company's last reported value. We assume companies with shrinking free cash flow will slow their rate of shrinkage, and that companies with growing free cash flow will see their growth rate slow, over this period. We do this to reflect that growth tends to slow more in the early years than it does in later years.
Generally we assume that a dollar today is more valuable than a dollar in the future, so we discount the value of these future cash flows to their estimated value in today's dollars:
10-year free cash flow (FCF) forecast
| 2023 | 2024 | 2025 | 2026 | 2027 | 2028 | 2029 | 2030 | 2031 | 2032 | |
| Levered FCF (SEK, Millions) | kr5.75m | kr7.99m | kr10.2m | kr12.2m | kr13.9m | kr15.2m | kr16.3m | kr17.1m | kr17.8m | kr18.2m |
| Growth Rate Estimate Source | Est @ 55.59% | Est @ 39.09% | Est @ 27.53% | Est @ 19.44% | Est @ 13.78% | Est @ 9.82% | Est @ 7.04% | Est @ 5.10% | Est @ 3.74% | Est @ 2.79% |
| Present Value (SEK, Millions) Discounted @ 9.2% | kr5.3 | kr6.7 | kr7.8 | kr8.6 | kr8.9 | kr9.0 | kr8.8 | kr8.5 | kr8.0 | kr7.6 |
("Est" = FCF growth rate estimated by Simply Wall St)
Present Value of 10-year Cash Flow (PVCF) = kr79m
After calculating the present value of future cash flows in the initial 10-year period, we need to calculate the Terminal Value, which accounts for all future cash flows beyond the first stage. For a number of reasons a very conservative growth rate is used that cannot exceed that of a country's GDP growth. In this case we have used the 5-year average of the 10-year government bond yield (0.6%) to estimate future growth. In the same way as with the 10-year 'growth' period, we discount future cash flows to today's value, using a cost of equity of 9.2%.
Terminal Value (TV)= FCF2032 × (1 + g) ÷ (r – g) = kr18m× (1 + 0.6%) ÷ (9.2%– 0.6%) = kr212m
Present Value of Terminal Value (PVTV)= TV / (1 + r)10= kr212m÷ ( 1 + 9.2%)10= kr88m
The total value is the sum of cash flows for the next ten years plus the discounted terminal value, which results in the Total Equity Value, which in this case is kr167m. In the final step we divide the equity value by the number of shares outstanding. Compared to the current share price of kr0.9, the company appears about fair value at a 15% discount to where the stock price trades currently. Remember though, that this is just an approximate valuation, and like any complex formula - garbage in, garbage out.
The Assumptions
The calculation above is very dependent on two assumptions. The first is the discount rate and the other is the cash flows. If you don't agree with these result, have a go at the calculation yourself and play with the assumptions. The DCF also does not consider the possible cyclicality of an industry, or a company's future capital requirements, so it does not give a full picture of a company's potential performance. Given that we are looking at Sustainion Group as potential shareholders, the cost of equity is used as the discount rate, rather than the cost of capital (or weighted average cost of capital, WACC) which accounts for debt. In this calculation we've used 9.2%, which is based on a levered beta of 1.455. Beta is a measure of a stock's volatility, compared to the market as a whole. We get our beta from the industry average beta of globally comparable companies, with an imposed limit between 0.8 and 2.0, which is a reasonable range for a stable business.
SWOT Analysis for Sustainion Group
Strength
- Debt is well covered by cash flow.
Weakness
- Earnings declined over the past year.
- Interest payments on debt are not well covered.
Opportunity
- Current share price is below our estimate of fair value.
- Lack of analyst coverage makes it difficult to determine SUSG's earnings prospects.
Threat
- No apparent threats visible for SUSG.
Looking Ahead:
Valuation is only one side of the coin in terms of building your investment thesis, and it is only one of many factors that you need to assess for a company. DCF models are not the be-all and end-all of investment valuation. Rather it should be seen as a guide to "what assumptions need to be true for this stock to be under/overvalued?" For instance, if the terminal value growth rate is adjusted slightly, it can dramatically alter the overall result. For Sustainion Group, we've compiled three additional items you should further research:
- Risks: Consider for instance, the ever-present spectre of investment risk. We've identified 4 warning signs with Sustainion Group , and understanding these should be part of your investment process.
- Other High Quality Alternatives: Do you like a good all-rounder? Explore our interactive list of high quality stocks to get an idea of what else is out there you may be missing!
- Other Environmentally-Friendly Companies: Concerned about the environment and think consumers will buy eco-friendly products more and more? Browse through our interactive list of companies that are thinking about a greener future to discover some stocks you may not have thought of!
PS. The Simply Wall St app conducts a discounted cash flow valuation for every stock on the NGM every day. If you want to find the calculation for other stocks just search here.
New: Manage All Your Stock Portfolios in One Place
We've created the ultimate portfolio companion for stock investors, and it's free.
• Connect an unlimited number of Portfolios and see your total in one currency
• Be alerted to new Warning Signs or Risks via email or mobile
• Track the Fair Value of your stocks
Have feedback on this article? Concerned about the content? Get in touch with us directly. Alternatively, email editorial-team (at) simplywallst.com.
This article by Simply Wall St is general in nature. We provide commentary based on historical data and analyst forecasts only using an unbiased methodology and our articles are not intended to be financial advice. It does not constitute a recommendation to buy or sell any stock, and does not take account of your objectives, or your financial situation. We aim to bring you long-term focused analysis driven by fundamental data. Note that our analysis may not factor in the latest price-sensitive company announcements or qualitative material. Simply Wall St has no position in any stocks mentioned.
About NGM:SUSG
Sustainion Group
Through its subsidiaries, develops and sells security products in Sweden.
Adequate balance sheet slight.
Market Insights

Advertisement
Community Narratives
MicroVision will explode future revenue by 380.37% with a vision towards success
Fair Value US$60.00|98.5% undervalued
TH
Community Contributor
The Indispensable Artery for a New North American Economy
Fair Value CA$132.87|2.3% undervalued
TI
Community Contributor