Fortnox (STO:FNOX) shareholders have earned a 52% CAGR over the last five years


Long term investing can be life changing when you buy and hold the truly great businesses. And highest quality companies can see their share prices grow by huge amounts. For example, the Fortnox AB (publ) (STO:FNOX) share price is up a whopping 716% in the last half decade, a handsome return for long term holders. And this is just one example of the epic gains achieved by some long term investors. On top of that, the share price is up 36% in about a quarter. The company reported its financial results recently; you can catch up on the latest numbers by reading our company report. Anyone who held for that rewarding ride would probably be keen to talk about it.
So let's investigate and see if the longer term performance of the company has been in line with the underlying business' progress.
See our latest analysis for Fortnox
While the efficient markets hypothesis continues to be taught by some, it has been proven that markets are over-reactive dynamic systems, and investors are not always rational. One way to examine how market sentiment has changed over time is to look at the interaction between a company's share price and its earnings per share (EPS).
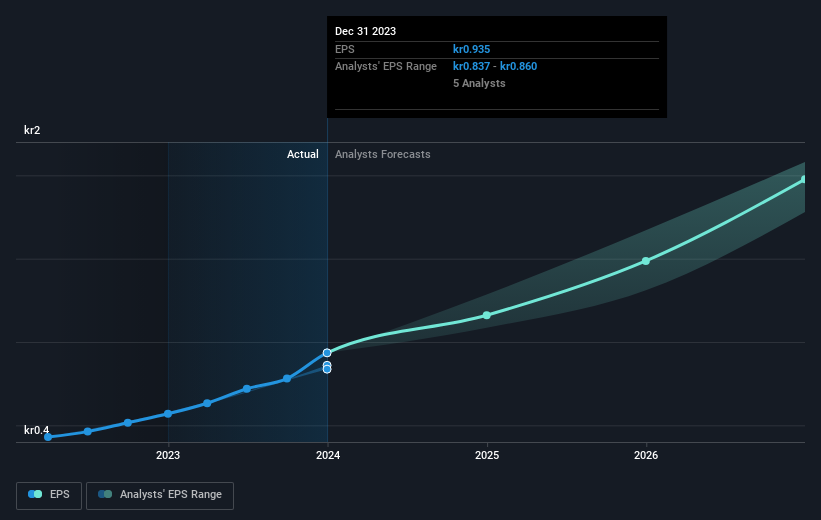
During five years of share price growth, Fortnox achieved compound earnings per share (EPS) growth of 48% per year. So the EPS growth rate is rather close to the annualized share price gain of 52% per year. Therefore one could conclude that sentiment towards the shares hasn't morphed very much. In fact, the share price seems to largely reflect the EPS growth.
The image below shows how EPS has tracked over time (if you click on the image you can see greater detail).
We consider it positive that insiders have made significant purchases in the last year. Having said that, most people consider earnings and revenue growth trends to be a more meaningful guide to the business. Dive deeper into the earnings by checking this interactive graph of Fortnox's earnings, revenue and cash flow.
What About Dividends?
As well as measuring the share price return, investors should also consider the total shareholder return (TSR). The TSR is a return calculation that accounts for the value of cash dividends (assuming that any dividend received was reinvested) and the calculated value of any discounted capital raisings and spin-offs. Arguably, the TSR gives a more comprehensive picture of the return generated by a stock. We note that for Fortnox the TSR over the last 5 years was 722%, which is better than the share price return mentioned above. The dividends paid by the company have thusly boosted the total shareholder return.
A Different Perspective
Fortnox's TSR for the year was broadly in line with the market average, at 22%. It has to be noted that the recent return falls short of the 52% shareholders have gained each year, over half a decade. More recently, the share price growth has slowed. But it has to be said the overall picture is one of good long term and short term performance. Arguably that makes Fortnox a stock worth watching. If you want to research this stock further, the data on insider buying is an obvious place to start. You can click here to see who has been buying shares - and the price they paid.
If you like to buy stocks alongside management, then you might just love this free list of companies. (Hint: insiders have been buying them).
Please note, the market returns quoted in this article reflect the market weighted average returns of stocks that currently trade on Swedish exchanges.
New: AI Stock Screener & Alerts
Our new AI Stock Screener scans the market every day to uncover opportunities.
• Dividend Powerhouses (3%+ Yield)
• Undervalued Small Caps with Insider Buying
• High growth Tech and AI Companies
Or build your own from over 50 metrics.
Have feedback on this article? Concerned about the content? Get in touch with us directly. Alternatively, email editorial-team (at) simplywallst.com.
This article by Simply Wall St is general in nature. We provide commentary based on historical data and analyst forecasts only using an unbiased methodology and our articles are not intended to be financial advice. It does not constitute a recommendation to buy or sell any stock, and does not take account of your objectives, or your financial situation. We aim to bring you long-term focused analysis driven by fundamental data. Note that our analysis may not factor in the latest price-sensitive company announcements or qualitative material. Simply Wall St has no position in any stocks mentioned.
About OM:FNOX
Fortnox
Provides products, packages, and integrations for financial and administration applications in small and medium sized businesses, accounting firms, and organizations.
Outstanding track record with flawless balance sheet.
