
Advertisement
- Sweden
- /
- Semiconductors
- /
- OM:SIVE
Sivers Semiconductors AB (publ)'s (STO:SIVE) 33% Jump Shows Its Popularity With Investors
Those holding Sivers Semiconductors AB (publ) (STO:SIVE) shares would be relieved that the share price has rebounded 33% in the last thirty days, but it needs to keep going to repair the recent damage it has caused to investor portfolios. Unfortunately, the gains of the last month did little to right the losses of the last year with the stock still down 21% over that time.
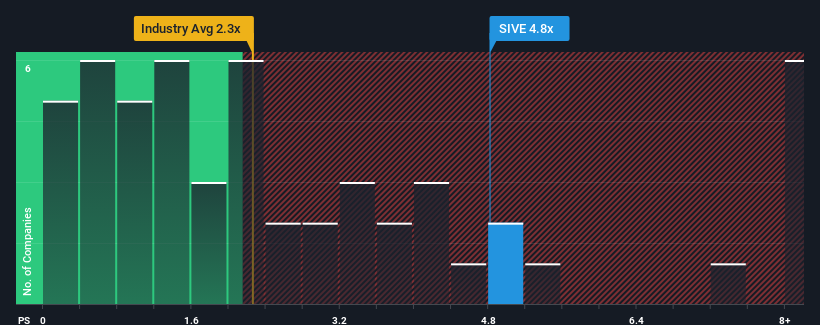
After such a large jump in price, Sivers Semiconductors' price-to-sales (or "P/S") ratio of 4.8x might make it look like a sell right now compared to the wider Semiconductor industry in Sweden, where around half of the companies have P/S ratios below 3.7x and even P/S below 1.2x are quite common. However, the P/S might be high for a reason and it requires further investigation to determine if it's justified.
See our latest analysis for Sivers Semiconductors
How Sivers Semiconductors Has Been Performing
With revenue growth that's superior to most other companies of late, Sivers Semiconductors has been doing relatively well. It seems that many are expecting the strong revenue performance to persist, which has raised the P/S. However, if this isn't the case, investors might get caught out paying too much for the stock.
Want the full picture on analyst estimates for the company? Then our free report on Sivers Semiconductors will help you uncover what's on the horizon.Is There Enough Revenue Growth Forecasted For Sivers Semiconductors?
Sivers Semiconductors' P/S ratio would be typical for a company that's expected to deliver solid growth, and importantly, perform better than the industry.
If we review the last year of revenue growth, the company posted a terrific increase of 23%. Pleasingly, revenue has also lifted 96% in aggregate from three years ago, thanks to the last 12 months of growth. So we can start by confirming that the company has done a great job of growing revenue over that time.
Shifting to the future, estimates from the lone analyst covering the company suggest revenue should grow by 63% each year over the next three years. With the industry only predicted to deliver 18% per year, the company is positioned for a stronger revenue result.
With this information, we can see why Sivers Semiconductors is trading at such a high P/S compared to the industry. Apparently shareholders aren't keen to offload something that is potentially eyeing a more prosperous future.
The Key Takeaway
Sivers Semiconductors' P/S is on the rise since its shares have risen strongly. Typically, we'd caution against reading too much into price-to-sales ratios when settling on investment decisions, though it can reveal plenty about what other market participants think about the company.
Our look into Sivers Semiconductors shows that its P/S ratio remains high on the merit of its strong future revenues. At this stage investors feel the potential for a deterioration in revenues is quite remote, justifying the elevated P/S ratio. Unless these conditions change, they will continue to provide strong support to the share price.
Plus, you should also learn about these 3 warning signs we've spotted with Sivers Semiconductors (including 2 which are a bit concerning).
If these risks are making you reconsider your opinion on Sivers Semiconductors, explore our interactive list of high quality stocks to get an idea of what else is out there.
New: Manage All Your Stock Portfolios in One Place
We've created the ultimate portfolio companion for stock investors, and it's free.
• Connect an unlimited number of Portfolios and see your total in one currency
• Be alerted to new Warning Signs or Risks via email or mobile
• Track the Fair Value of your stocks
Have feedback on this article? Concerned about the content? Get in touch with us directly. Alternatively, email editorial-team (at) simplywallst.com.
This article by Simply Wall St is general in nature. We provide commentary based on historical data and analyst forecasts only using an unbiased methodology and our articles are not intended to be financial advice. It does not constitute a recommendation to buy or sell any stock, and does not take account of your objectives, or your financial situation. We aim to bring you long-term focused analysis driven by fundamental data. Note that our analysis may not factor in the latest price-sensitive company announcements or qualitative material. Simply Wall St has no position in any stocks mentioned.
Have feedback on this article? Concerned about the content? Get in touch with us directly. Alternatively, email editorial-team@simplywallst.com
About OM:SIVE
Sivers Semiconductors
Through its subsidiaries, develops, manufactures, and sells chips, components, modules, and subsystems in North America, Europe, and Asia.
Good value with adequate balance sheet.
Market Insights

Advertisement
Community Narratives
MicroVision will explode future revenue by 380.37% with a vision towards success
Fair Value US$60.00|98.4% undervalued
TH
Community Contributor
The Indispensable Artery for a New North American Economy
Fair Value CA$132.87|1.3% undervalued
TI
Community Contributor