
Advertisement
- Sweden
- /
- Semiconductors
- /
- OM:SIVE
Revenues Tell The Story For Sivers Semiconductors AB (publ) (STO:SIVE) As Its Stock Soars 33%
Those holding Sivers Semiconductors AB (publ) (STO:SIVE) shares would be relieved that the share price has rebounded 33% in the last thirty days, but it needs to keep going to repair the recent damage it has caused to investor portfolios. Unfortunately, the gains of the last month did little to right the losses of the last year with the stock still down 39% over that time.
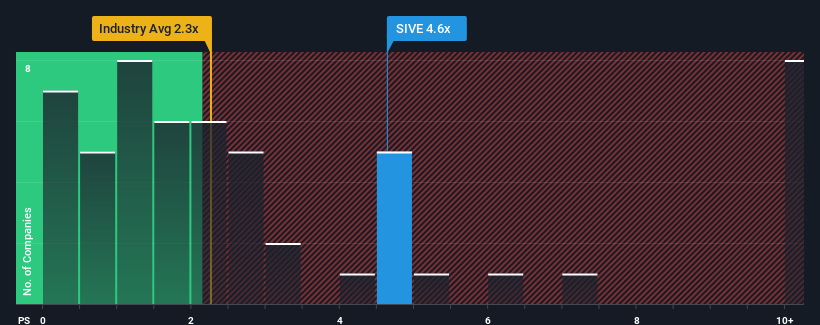
Since its price has surged higher, Sivers Semiconductors may be sending sell signals at present with a price-to-sales (or "P/S") ratio of 4.6x, when you consider almost half of the companies in the Semiconductor industry in Sweden have P/S ratios under 3.8x and even P/S lower than 0.6x aren't out of the ordinary. Nonetheless, we'd need to dig a little deeper to determine if there is a rational basis for the elevated P/S.
View our latest analysis for Sivers Semiconductors
How Sivers Semiconductors Has Been Performing
Recent times have been advantageous for Sivers Semiconductors as its revenues have been rising faster than most other companies. The P/S is probably high because investors think this strong revenue performance will continue. You'd really hope so, otherwise you're paying a pretty hefty price for no particular reason.
If you'd like to see what analysts are forecasting going forward, you should check out our free report on Sivers Semiconductors.How Is Sivers Semiconductors' Revenue Growth Trending?
The only time you'd be truly comfortable seeing a P/S as high as Sivers Semiconductors' is when the company's growth is on track to outshine the industry.
If we review the last year of revenue growth, the company posted a terrific increase of 40%. The strong recent performance means it was also able to grow revenue by 102% in total over the last three years. So we can start by confirming that the company has done a great job of growing revenue over that time.
Shifting to the future, estimates from the lone analyst covering the company suggest revenue should grow by 72% per annum over the next three years. Meanwhile, the rest of the industry is forecast to only expand by 12% each year, which is noticeably less attractive.
With this in mind, it's not hard to understand why Sivers Semiconductors' P/S is high relative to its industry peers. It seems most investors are expecting this strong future growth and are willing to pay more for the stock.
The Key Takeaway
Sivers Semiconductors shares have taken a big step in a northerly direction, but its P/S is elevated as a result. We'd say the price-to-sales ratio's power isn't primarily as a valuation instrument but rather to gauge current investor sentiment and future expectations.
We've established that Sivers Semiconductors maintains its high P/S on the strength of its forecasted revenue growth being higher than the the rest of the Semiconductor industry, as expected. At this stage investors feel the potential for a deterioration in revenues is quite remote, justifying the elevated P/S ratio. Unless these conditions change, they will continue to provide strong support to the share price.
You should always think about risks. Case in point, we've spotted 3 warning signs for Sivers Semiconductors you should be aware of, and 2 of them make us uncomfortable.
If you're unsure about the strength of Sivers Semiconductors' business, why not explore our interactive list of stocks with solid business fundamentals for some other companies you may have missed.
New: Manage All Your Stock Portfolios in One Place
We've created the ultimate portfolio companion for stock investors, and it's free.
• Connect an unlimited number of Portfolios and see your total in one currency
• Be alerted to new Warning Signs or Risks via email or mobile
• Track the Fair Value of your stocks
Have feedback on this article? Concerned about the content? Get in touch with us directly. Alternatively, email editorial-team (at) simplywallst.com.
This article by Simply Wall St is general in nature. We provide commentary based on historical data and analyst forecasts only using an unbiased methodology and our articles are not intended to be financial advice. It does not constitute a recommendation to buy or sell any stock, and does not take account of your objectives, or your financial situation. We aim to bring you long-term focused analysis driven by fundamental data. Note that our analysis may not factor in the latest price-sensitive company announcements or qualitative material. Simply Wall St has no position in any stocks mentioned.
About OM:SIVE
Sivers Semiconductors
Through its subsidiaries, develops, manufactures, and sells chips, components, modules, and subsystems in North America, Europe, and Asia.
Good value with adequate balance sheet.
Market Insights

Advertisement
Community Narratives
MicroVision will explode future revenue by 380.37% with a vision towards success
Fair Value US$60.00|98.4% undervalued
TH
Community Contributor
The Indispensable Artery for a New North American Economy
Fair Value CA$132.87|1.1% undervalued
TI
Community Contributor