
Advertisement
- Sweden
- /
- Semiconductors
- /
- OM:SIVE
Estimating The Fair Value Of Sivers Semiconductors AB (publ) (STO:SIVE)
Key Insights
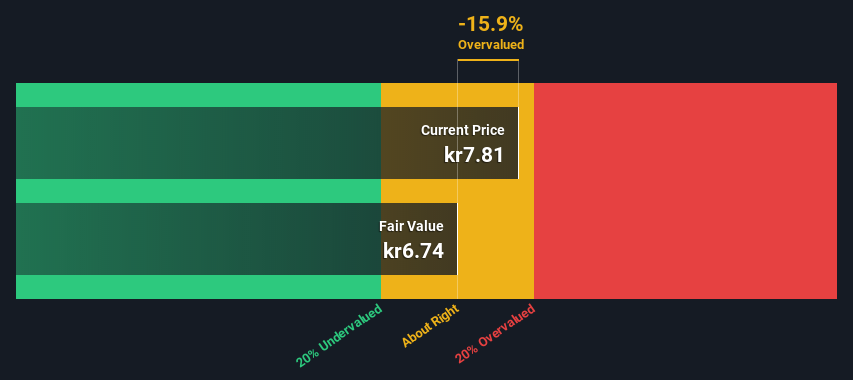
- Using the 2 Stage Free Cash Flow to Equity, Sivers Semiconductors fair value estimate is kr6.74
- With kr7.81 share price, Sivers Semiconductors appears to be trading close to its estimated fair value
- Industry average of 44% suggests Sivers Semiconductors' peers are currently trading at a higher premium to fair value
In this article we are going to estimate the intrinsic value of Sivers Semiconductors AB (publ) (STO:SIVE) by taking the forecast future cash flows of the company and discounting them back to today's value. This will be done using the Discounted Cash Flow (DCF) model. There's really not all that much to it, even though it might appear quite complex.
We generally believe that a company's value is the present value of all of the cash it will generate in the future. However, a DCF is just one valuation metric among many, and it is not without flaws. If you want to learn more about discounted cash flow, the rationale behind this calculation can be read in detail in the Simply Wall St analysis model.
View our latest analysis for Sivers Semiconductors
The Model
We are going to use a two-stage DCF model, which, as the name states, takes into account two stages of growth. The first stage is generally a higher growth period which levels off heading towards the terminal value, captured in the second 'steady growth' period. In the first stage we need to estimate the cash flows to the business over the next ten years. Where possible we use analyst estimates, but when these aren't available we extrapolate the previous free cash flow (FCF) from the last estimate or reported value. We assume companies with shrinking free cash flow will slow their rate of shrinkage, and that companies with growing free cash flow will see their growth rate slow, over this period. We do this to reflect that growth tends to slow more in the early years than it does in later years.
Generally we assume that a dollar today is more valuable than a dollar in the future, and so the sum of these future cash flows is then discounted to today's value:
10-year free cash flow (FCF) forecast
| 2023 | 2024 | 2025 | 2026 | 2027 | 2028 | 2029 | 2030 | 2031 | 2032 | |
| Levered FCF (SEK, Millions) | -kr35.0m | kr17.0m | kr42.0m | kr65.0m | kr90.0m | kr114.5m | kr136.4m | kr155.0m | kr170.0m | kr181.8m |
| Growth Rate Estimate Source | Analyst x1 | Analyst x1 | Analyst x1 | Est @ 54.78% | Est @ 38.52% | Est @ 27.13% | Est @ 19.16% | Est @ 13.59% | Est @ 9.68% | Est @ 6.95% |
| Present Value (SEK, Millions) Discounted @ 8.3% | -kr32.3 | kr14.5 | kr33.0 | kr47.2 | kr60.3 | kr70.8 | kr77.9 | kr81.6 | kr82.7 | kr81.6 |
("Est" = FCF growth rate estimated by Simply Wall St)
Present Value of 10-year Cash Flow (PVCF) = kr517m
After calculating the present value of future cash flows in the initial 10-year period, we need to calculate the Terminal Value, which accounts for all future cash flows beyond the first stage. The Gordon Growth formula is used to calculate Terminal Value at a future annual growth rate equal to the 5-year average of the 10-year government bond yield of 0.6%. We discount the terminal cash flows to today's value at a cost of equity of 8.3%.
Terminal Value (TV)= FCF2032 × (1 + g) ÷ (r – g) = kr182m× (1 + 0.6%) ÷ (8.3%– 0.6%) = kr2.4b
Present Value of Terminal Value (PVTV)= TV / (1 + r)10= kr2.4b÷ ( 1 + 8.3%)10= kr1.1b
The total value is the sum of cash flows for the next ten years plus the discounted terminal value, which results in the Total Equity Value, which in this case is kr1.6b. The last step is to then divide the equity value by the number of shares outstanding. Relative to the current share price of kr7.8, the company appears around fair value at the time of writing. Valuations are imprecise instruments though, rather like a telescope - move a few degrees and end up in a different galaxy. Do keep this in mind.
The Assumptions
The calculation above is very dependent on two assumptions. The first is the discount rate and the other is the cash flows. Part of investing is coming up with your own evaluation of a company's future performance, so try the calculation yourself and check your own assumptions. The DCF also does not consider the possible cyclicality of an industry, or a company's future capital requirements, so it does not give a full picture of a company's potential performance. Given that we are looking at Sivers Semiconductors as potential shareholders, the cost of equity is used as the discount rate, rather than the cost of capital (or weighted average cost of capital, WACC) which accounts for debt. In this calculation we've used 8.3%, which is based on a levered beta of 1.308. Beta is a measure of a stock's volatility, compared to the market as a whole. We get our beta from the industry average beta of globally comparable companies, with an imposed limit between 0.8 and 2.0, which is a reasonable range for a stable business.
SWOT Analysis for Sivers Semiconductors
Strength
- Debt is well covered by earnings.
Weakness
- Current share price is above our estimate of fair value.
- Shareholders have been diluted in the past year.
Opportunity
- Forecast to reduce losses next year.
Threat
- Debt is not well covered by operating cash flow.
- Has less than 3 years of cash runway based on current free cash flow.
Next Steps:
Although the valuation of a company is important, it ideally won't be the sole piece of analysis you scrutinize for a company. The DCF model is not a perfect stock valuation tool. Instead the best use for a DCF model is to test certain assumptions and theories to see if they would lead to the company being undervalued or overvalued. For example, changes in the company's cost of equity or the risk free rate can significantly impact the valuation. For Sivers Semiconductors, we've compiled three additional aspects you should assess:
- Risks: Take risks, for example - Sivers Semiconductors has 4 warning signs (and 1 which doesn't sit too well with us) we think you should know about.
- Management:Have insiders been ramping up their shares to take advantage of the market's sentiment for SIVE's future outlook? Check out our management and board analysis with insights on CEO compensation and governance factors.
- Other High Quality Alternatives: Do you like a good all-rounder? Explore our interactive list of high quality stocks to get an idea of what else is out there you may be missing!
PS. Simply Wall St updates its DCF calculation for every Swedish stock every day, so if you want to find the intrinsic value of any other stock just search here.
New: Manage All Your Stock Portfolios in One Place
We've created the ultimate portfolio companion for stock investors, and it's free.
• Connect an unlimited number of Portfolios and see your total in one currency
• Be alerted to new Warning Signs or Risks via email or mobile
• Track the Fair Value of your stocks
Have feedback on this article? Concerned about the content? Get in touch with us directly. Alternatively, email editorial-team (at) simplywallst.com.
This article by Simply Wall St is general in nature. We provide commentary based on historical data and analyst forecasts only using an unbiased methodology and our articles are not intended to be financial advice. It does not constitute a recommendation to buy or sell any stock, and does not take account of your objectives, or your financial situation. We aim to bring you long-term focused analysis driven by fundamental data. Note that our analysis may not factor in the latest price-sensitive company announcements or qualitative material. Simply Wall St has no position in any stocks mentioned.
About OM:SIVE
Sivers Semiconductors
Through its subsidiaries, develops, manufactures, and sells chips, components, modules, and subsystems in North America, Europe, and Asia.
Good value with adequate balance sheet.
Market Insights

Advertisement
Community Narratives
MicroVision will explode future revenue by 380.37% with a vision towards success
Fair Value US$60.00|98.5% undervalued
TH
Community Contributor
The Indispensable Artery for a New North American Economy
Fair Value CA$132.87|2.3% undervalued
TI
Community Contributor