
Advertisement
- Sweden
- /
- Real Estate
- /
- OM:DIOS
Diös Fastigheter (STO:DIOS shareholders incur further losses as stock declines 6.1% this week, taking three-year losses to 23%
Many investors define successful investing as beating the market average over the long term. But its virtually certain that sometimes you will buy stocks that fall short of the market average returns. We regret to report that long term Diös Fastigheter AB (publ) (STO:DIOS) shareholders have had that experience, with the share price dropping 28% in three years, versus a market return of about 20%.
After losing 6.1% this past week, it's worth investigating the company's fundamentals to see what we can infer from past performance.
Check out our latest analysis for Diös Fastigheter
While the efficient markets hypothesis continues to be taught by some, it has been proven that markets are over-reactive dynamic systems, and investors are not always rational. One flawed but reasonable way to assess how sentiment around a company has changed is to compare the earnings per share (EPS) with the share price.
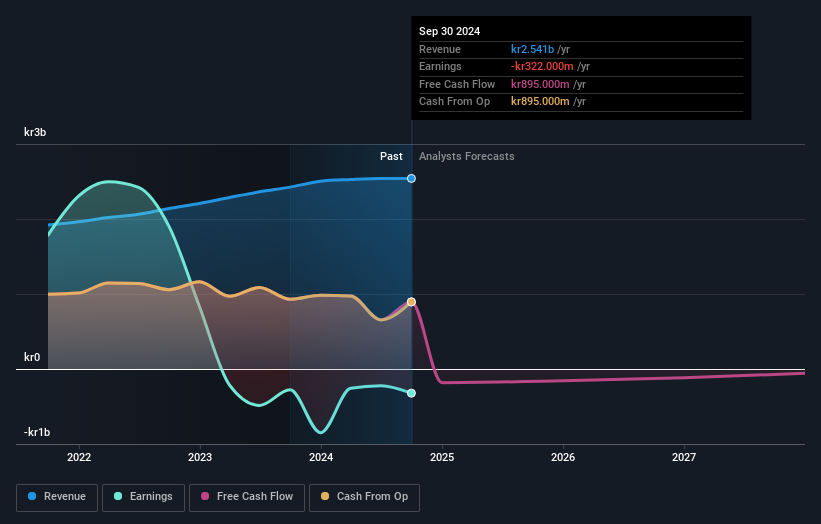
We know that Diös Fastigheter has been profitable in the past. However, it made a loss in the last twelve months, suggesting profit may be an unreliable metric at this stage. Other metrics may better explain the share price move.
We note that, in three years, revenue has actually grown at a 10% annual rate, so that doesn't seem to be a reason to sell shares. It's probably worth investigating Diös Fastigheter further; while we may be missing something on this analysis, there might also be an opportunity.
The company's revenue and earnings (over time) are depicted in the image below (click to see the exact numbers).
This free interactive report on Diös Fastigheter's balance sheet strength is a great place to start, if you want to investigate the stock further.
What About The Total Shareholder Return (TSR)?
Investors should note that there's a difference between Diös Fastigheter's total shareholder return (TSR) and its share price change, which we've covered above. The TSR attempts to capture the value of dividends (as if they were reinvested) as well as any spin-offs or discounted capital raisings offered to shareholders. Its history of dividend payouts mean that Diös Fastigheter's TSR, which was a 23% drop over the last 3 years, was not as bad as the share price return.
A Different Perspective
Investors in Diös Fastigheter had a tough year, with a total loss of 3.6%, against a market gain of about 17%. Even the share prices of good stocks drop sometimes, but we want to see improvements in the fundamental metrics of a business, before getting too interested. Unfortunately, last year's performance may indicate unresolved challenges, given that it was worse than the annualised loss of 3% over the last half decade. We realise that Baron Rothschild has said investors should "buy when there is blood on the streets", but we caution that investors should first be sure they are buying a high quality business. It's always interesting to track share price performance over the longer term. But to understand Diös Fastigheter better, we need to consider many other factors. For instance, we've identified 2 warning signs for Diös Fastigheter that you should be aware of.
If you are like me, then you will not want to miss this free list of undervalued small caps that insiders are buying.
Please note, the market returns quoted in this article reflect the market weighted average returns of stocks that currently trade on Swedish exchanges.
New: Manage All Your Stock Portfolios in One Place
We've created the ultimate portfolio companion for stock investors, and it's free.
• Connect an unlimited number of Portfolios and see your total in one currency
• Be alerted to new Warning Signs or Risks via email or mobile
• Track the Fair Value of your stocks
Have feedback on this article? Concerned about the content? Get in touch with us directly. Alternatively, email editorial-team (at) simplywallst.com.
This article by Simply Wall St is general in nature. We provide commentary based on historical data and analyst forecasts only using an unbiased methodology and our articles are not intended to be financial advice. It does not constitute a recommendation to buy or sell any stock, and does not take account of your objectives, or your financial situation. We aim to bring you long-term focused analysis driven by fundamental data. Note that our analysis may not factor in the latest price-sensitive company announcements or qualitative material. Simply Wall St has no position in any stocks mentioned.
About OM:DIOS
Diös Fastigheter
Develops, owns, and rents commercial and residential properties in Sweden.
Fair value second-rate dividend payer.
Similar Companies
Market Insights

Advertisement
Community Narratives
The "Molecular Pencil": Why Beam's Technology is Built to Win
Fair Value US$65.01|65.4% undervalued
DA
Community Contributor
The silent giant behind virtually every advanced chip powering AI, smartphones, and modern infrastructure.
Fair Value US$310.00|6.1% undervalued
OS
Community Contributor
ADP Stock: Solid Fundamentals, But AI Investments Test Its Margin Resilience
Fair Value US$387.77|34.2% undervalued
YI
Community Contributor
MINISO's fair value is projected at 26.69 with an anticipated PE ratio shift of 20x
Fair Value US$24.03|9.6% undervalued
BE
Community Contributor