
Advertisement
- Sweden
- /
- Real Estate
- /
- OM:BOHO
Boho Group AB (publ) (STO:BOHO) Stock Rockets 42% But Many Are Still Ignoring The Company
Boho Group AB (publ) (STO:BOHO) shares have had a really impressive month, gaining 42% after a shaky period beforehand. Not all shareholders will be feeling jubilant, since the share price is still down a very disappointing 14% in the last twelve months.
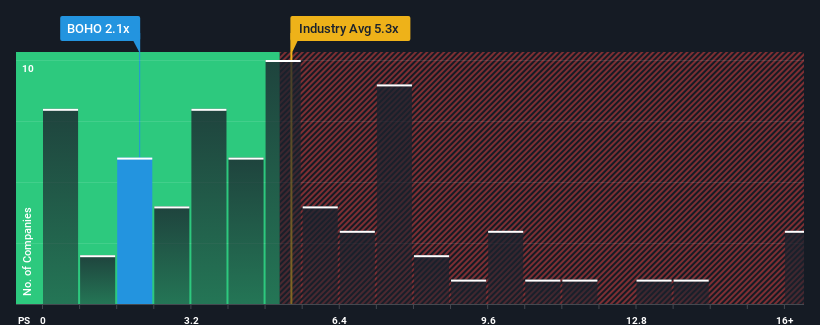
In spite of the firm bounce in price, considering about half the companies operating in Sweden's Real Estate industry have price-to-sales ratios (or "P/S") above 5.3x, you may still consider Boho Group as an great investment opportunity with its 2.1x P/S ratio. Nonetheless, we'd need to dig a little deeper to determine if there is a rational basis for the highly reduced P/S.
View our latest analysis for Boho Group
How Has Boho Group Performed Recently?
With revenue growth that's exceedingly strong of late, Boho Group has been doing very well. Perhaps the market is expecting future revenue performance to dwindle, which has kept the P/S suppressed. If that doesn't eventuate, then existing shareholders have reason to be quite optimistic about the future direction of the share price.
Although there are no analyst estimates available for Boho Group, take a look at this free data-rich visualisation to see how the company stacks up on earnings, revenue and cash flow.Is There Any Revenue Growth Forecasted For Boho Group?
The only time you'd be truly comfortable seeing a P/S as depressed as Boho Group's is when the company's growth is on track to lag the industry decidedly.
Retrospectively, the last year delivered an exceptional 31% gain to the company's top line. The strong recent performance means it was also able to grow revenue by 144% in total over the last three years. So we can start by confirming that the company has done a great job of growing revenue over that time.
When compared to the industry's one-year growth forecast of 6.2%, the most recent medium-term revenue trajectory is noticeably more alluring
With this in mind, we find it intriguing that Boho Group's P/S isn't as high compared to that of its industry peers. Apparently some shareholders believe the recent performance has exceeded its limits and have been accepting significantly lower selling prices.
The Bottom Line On Boho Group's P/S
Boho Group's recent share price jump still sees fails to bring its P/S alongside the industry median. We'd say the price-to-sales ratio's power isn't primarily as a valuation instrument but rather to gauge current investor sentiment and future expectations.
Our examination of Boho Group revealed its three-year revenue trends aren't boosting its P/S anywhere near as much as we would have predicted, given they look better than current industry expectations. When we see strong revenue with faster-than-industry growth, we assume there are some significant underlying risks to the company's ability to make money which is applying downwards pressure on the P/S ratio. While recent revenue trends over the past medium-term suggest that the risk of a price decline is low, investors appear to perceive a likelihood of revenue fluctuations in the future.
Don't forget that there may be other risks. For instance, we've identified 4 warning signs for Boho Group (2 can't be ignored) you should be aware of.
It's important to make sure you look for a great company, not just the first idea you come across. So if growing profitability aligns with your idea of a great company, take a peek at this free list of interesting companies with strong recent earnings growth (and a low P/E).
Valuation is complex, but we're here to simplify it.
Discover if Boho Group might be undervalued or overvalued with our detailed analysis, featuring fair value estimates, potential risks, dividends, insider trades, and its financial condition.
Access Free AnalysisHave feedback on this article? Concerned about the content? Get in touch with us directly. Alternatively, email editorial-team (at) simplywallst.com.
This article by Simply Wall St is general in nature. We provide commentary based on historical data and analyst forecasts only using an unbiased methodology and our articles are not intended to be financial advice. It does not constitute a recommendation to buy or sell any stock, and does not take account of your objectives, or your financial situation. We aim to bring you long-term focused analysis driven by fundamental data. Note that our analysis may not factor in the latest price-sensitive company announcements or qualitative material. Simply Wall St has no position in any stocks mentioned.
About OM:BOHO
Low risk and overvalued.
Market Insights

Advertisement
Community Narratives
The company that turned a verb into a global necessity and basically runs the modern internet, digital ads, smartphones, maps, and AI.
Fair Value US$300.00|6.3% undervalued
OS
Community Contributor
Flowers Foods Pays A Fair Price For Health
Fair Value US$16.12|26.0% undervalued
NV
Community Contributor
TMX Group will thrive with 33.3% profit margin and enduring market moat
Fair Value CA$49.90|3.7% overvalued
LI
Community Contributor