CS Medica Full Year 2023 Earnings: kr.1.18 loss per share (vs kr.0.93 loss in FY 2022)


CS Medica (NGM:CSMED) Full Year 2023 Results
Key Financial Results
- Net loss: kr.14.5m (loss widened by 34% from FY 2022).
- kr.1.18 loss per share (further deteriorated from kr.0.93 loss in FY 2022).
CSMED Products In Clinical Trials
- Phase I: 4.
- Phase II: 2.
- Phase III: 8.
CSMED Post-Clinical Trial Products
- Launched (during full year): 9.
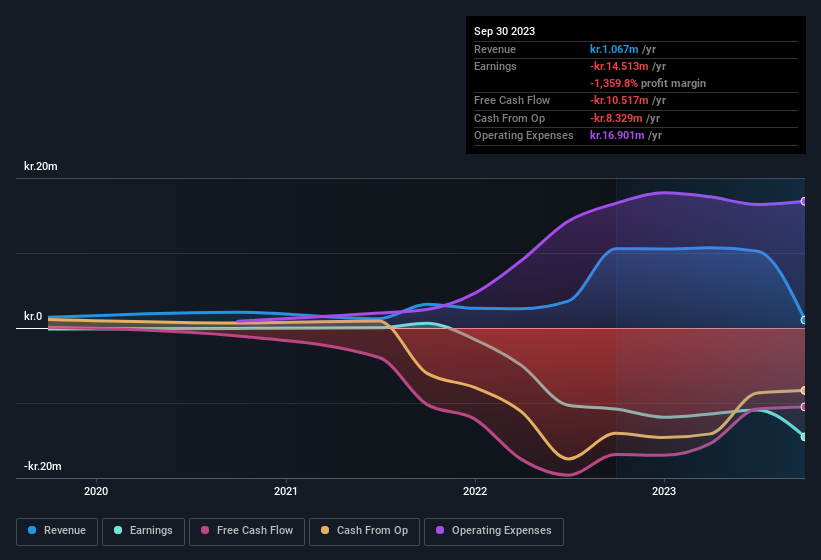
All figures shown in the chart above are for the trailing 12 month (TTM) period
CS Medica shares are down 6.2% from a week ago.
Risk Analysis
What about risks? Every company has them, and we've spotted 5 warning signs for CS Medica you should know about.
New: AI Stock Screener & Alerts
Our new AI Stock Screener scans the market every day to uncover opportunities.
• Dividend Powerhouses (3%+ Yield)
• Undervalued Small Caps with Insider Buying
• High growth Tech and AI Companies
Or build your own from over 50 metrics.
Have feedback on this article? Concerned about the content? Get in touch with us directly. Alternatively, email editorial-team (at) simplywallst.com.
This article by Simply Wall St is general in nature. We provide commentary based on historical data and analyst forecasts only using an unbiased methodology and our articles are not intended to be financial advice. It does not constitute a recommendation to buy or sell any stock, and does not take account of your objectives, or your financial situation. We aim to bring you long-term focused analysis driven by fundamental data. Note that our analysis may not factor in the latest price-sensitive company announcements or qualitative material. Simply Wall St has no position in any stocks mentioned.
About NGM:CSMED
CS Medica
CS MEDICA A/S develops, manufactures, and commercializes over the counter medical products containing cannabinoids for the treatment of psoriasis and arthritis.
Moderate with weak fundamentals.
