Stock Analysis
- Sweden
- /
- Paper and Forestry Products
- /
- OM:SCA B
Svenska Cellulosa Aktiebolaget (STO:SCA B) jumps 4.5% this week, though earnings growth is still tracking behind five-year shareholder returns

When we invest, we're generally looking for stocks that outperform the market average. And the truth is, you can make significant gains if you buy good quality businesses at the right price. To wit, the Svenska Cellulosa Aktiebolaget share price has climbed 92% in five years, easily topping the market return of 42% (ignoring dividends). However, more recent returns haven't been as impressive as that, with the stock returning just 23% in the last year , including dividends .
On the back of a solid 7-day performance, let's check what role the company's fundamentals have played in driving long term shareholder returns.
View our latest analysis for Svenska Cellulosa Aktiebolaget
While markets are a powerful pricing mechanism, share prices reflect investor sentiment, not just underlying business performance. One way to examine how market sentiment has changed over time is to look at the interaction between a company's share price and its earnings per share (EPS).
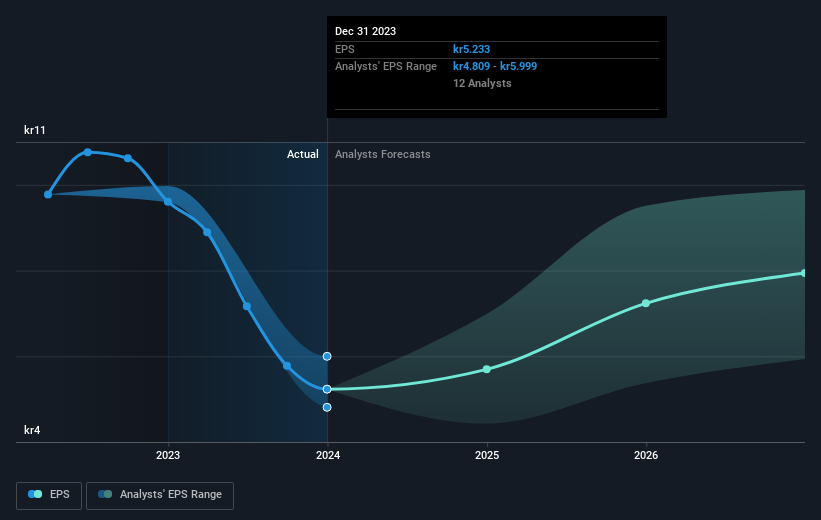
Over half a decade, Svenska Cellulosa Aktiebolaget managed to grow its earnings per share at 0.09% a year. This EPS growth is slower than the share price growth of 14% per year, over the same period. So it's fair to assume the market has a higher opinion of the business than it did five years ago. And that's hardly shocking given the track record of growth.
The image below shows how EPS has tracked over time (if you click on the image you can see greater detail).
It is of course excellent to see how Svenska Cellulosa Aktiebolaget has grown profits over the years, but the future is more important for shareholders. This free interactive report on Svenska Cellulosa Aktiebolaget's balance sheet strength is a great place to start, if you want to investigate the stock further.
What About Dividends?
It is important to consider the total shareholder return, as well as the share price return, for any given stock. The TSR is a return calculation that accounts for the value of cash dividends (assuming that any dividend received was reinvested) and the calculated value of any discounted capital raisings and spin-offs. Arguably, the TSR gives a more comprehensive picture of the return generated by a stock. In the case of Svenska Cellulosa Aktiebolaget, it has a TSR of 105% for the last 5 years. That exceeds its share price return that we previously mentioned. And there's no prize for guessing that the dividend payments largely explain the divergence!
A Different Perspective
It's good to see that Svenska Cellulosa Aktiebolaget has rewarded shareholders with a total shareholder return of 23% in the last twelve months. That's including the dividend. That gain is better than the annual TSR over five years, which is 15%. Therefore it seems like sentiment around the company has been positive lately. In the best case scenario, this may hint at some real business momentum, implying that now could be a great time to delve deeper. I find it very interesting to look at share price over the long term as a proxy for business performance. But to truly gain insight, we need to consider other information, too. For instance, we've identified 3 warning signs for Svenska Cellulosa Aktiebolaget that you should be aware of.
Of course Svenska Cellulosa Aktiebolaget may not be the best stock to buy. So you may wish to see this free collection of growth stocks.
Please note, the market returns quoted in this article reflect the market weighted average returns of stocks that currently trade on Swedish exchanges.
Valuation is complex, but we're helping make it simple.
Find out whether Svenska Cellulosa Aktiebolaget is potentially over or undervalued by checking out our comprehensive analysis, which includes fair value estimates, risks and warnings, dividends, insider transactions and financial health.
View the Free AnalysisHave feedback on this article? Concerned about the content? Get in touch with us directly. Alternatively, email editorial-team (at) simplywallst.com.
This article by Simply Wall St is general in nature. We provide commentary based on historical data and analyst forecasts only using an unbiased methodology and our articles are not intended to be financial advice. It does not constitute a recommendation to buy or sell any stock, and does not take account of your objectives, or your financial situation. We aim to bring you long-term focused analysis driven by fundamental data. Note that our analysis may not factor in the latest price-sensitive company announcements or qualitative material. Simply Wall St has no position in any stocks mentioned.
About OM:SCA B
Svenska Cellulosa Aktiebolaget
Svenska Cellulosa Aktiebolaget SCA (publ), a forest products company, develops, manufactures, and sells forest, wood, pulp, and containerboard products in Sweden, the United States, Germany, the United Kingdom, rest of Europe, Asia, and internationally.
Excellent balance sheet with moderate growth potential.
