- Sweden
- /
- Paper and Forestry Products
- /
- OM:HOLM B
Holmen's (STO:HOLM B) five-year earnings growth trails the impressive shareholder returns


When you buy shares in a company, it's worth keeping in mind the possibility that it could fail, and you could lose your money. But on a lighter note, a good company can see its share price rise well over 100%. For example, the Holmen AB (publ) (STO:HOLM B) share price has soared 120% in the last half decade. Most would be very happy with that. And in the last week the share price has popped 5.1%. But this could be related to the buoyant market which is up about 3.2% in a week.
Since the stock has added kr3.3b to its market cap in the past week alone, let's see if underlying performance has been driving long-term returns.
Check out our latest analysis for Holmen
To paraphrase Benjamin Graham: Over the short term the market is a voting machine, but over the long term it's a weighing machine. One way to examine how market sentiment has changed over time is to look at the interaction between a company's share price and its earnings per share (EPS).
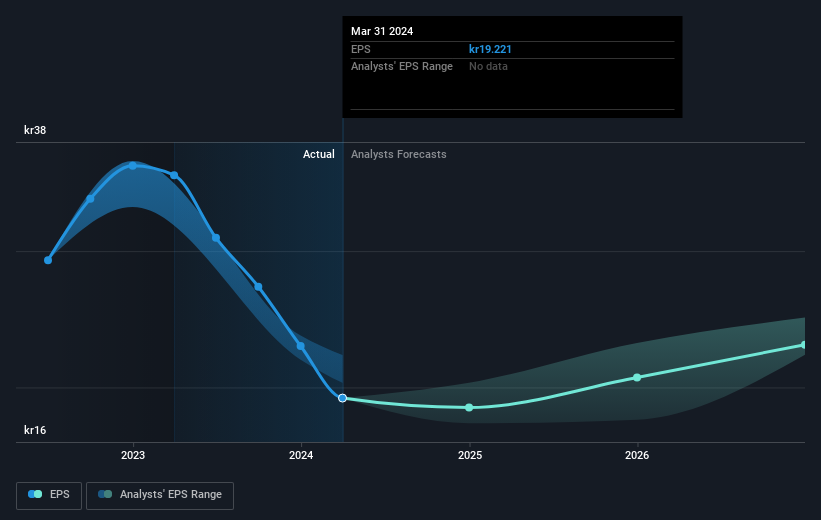
Over half a decade, Holmen managed to grow its earnings per share at 7.4% a year. This EPS growth is slower than the share price growth of 17% per year, over the same period. So it's fair to assume the market has a higher opinion of the business than it did five years ago. That's not necessarily surprising considering the five-year track record of earnings growth.
The image below shows how EPS has tracked over time (if you click on the image you can see greater detail).
It's good to see that there was some significant insider buying in the last three months. That's a positive. On the other hand, we think the revenue and earnings trends are much more meaningful measures of the business. This free interactive report on Holmen's earnings, revenue and cash flow is a great place to start, if you want to investigate the stock further.
What About Dividends?
As well as measuring the share price return, investors should also consider the total shareholder return (TSR). Whereas the share price return only reflects the change in the share price, the TSR includes the value of dividends (assuming they were reinvested) and the benefit of any discounted capital raising or spin-off. Arguably, the TSR gives a more comprehensive picture of the return generated by a stock. We note that for Holmen the TSR over the last 5 years was 150%, which is better than the share price return mentioned above. And there's no prize for guessing that the dividend payments largely explain the divergence!
A Different Perspective
Holmen shareholders are up 10% for the year (even including dividends). But that was short of the market average. If we look back over five years, the returns are even better, coming in at 20% per year for five years. Maybe the share price is just taking a breather while the business executes on its growth strategy. It's always interesting to track share price performance over the longer term. But to understand Holmen better, we need to consider many other factors. Even so, be aware that Holmen is showing 2 warning signs in our investment analysis , you should know about...
Holmen is not the only stock that insiders are buying. For those who like to find lesser know companies this free list of growing companies with recent insider purchasing, could be just the ticket.
Please note, the market returns quoted in this article reflect the market weighted average returns of stocks that currently trade on Swedish exchanges.
Valuation is complex, but we're here to simplify it.
Discover if Holmen might be undervalued or overvalued with our detailed analysis, featuring fair value estimates, potential risks, dividends, insider trades, and its financial condition.
Access Free AnalysisHave feedback on this article? Concerned about the content? Get in touch with us directly. Alternatively, email editorial-team (at) simplywallst.com.
This article by Simply Wall St is general in nature. We provide commentary based on historical data and analyst forecasts only using an unbiased methodology and our articles are not intended to be financial advice. It does not constitute a recommendation to buy or sell any stock, and does not take account of your objectives, or your financial situation. We aim to bring you long-term focused analysis driven by fundamental data. Note that our analysis may not factor in the latest price-sensitive company announcements or qualitative material. Simply Wall St has no position in any stocks mentioned.
Have feedback on this article? Concerned about the content? Get in touch with us directly. Alternatively, email editorial-team@simplywallst.com
About OM:HOLM B
Holmen
Engages in forest, paperboard, paper, wood products, and renewable energy businesses in Sweden and internationally.
Excellent balance sheet average dividend payer.
