- Sweden
- /
- Medical Equipment
- /
- OM:PAX
After Leaping 28% Paxman AB (publ) (STO:PAX) Shares Are Not Flying Under The Radar
Despite an already strong run, Paxman AB (publ) (STO:PAX) shares have been powering on, with a gain of 28% in the last thirty days. Looking back a bit further, it's encouraging to see the stock is up 100% in the last year.
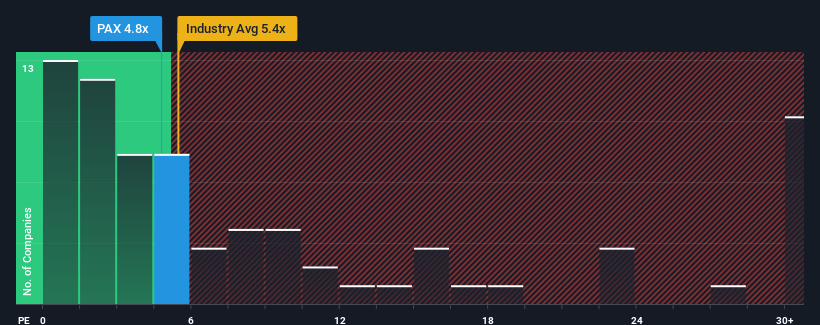
Although its price has surged higher, it's still not a stretch to say that Paxman's price-to-sales (or "P/S") ratio of 4.8x right now seems quite "middle-of-the-road" compared to the Medical Equipment industry in Sweden, where the median P/S ratio is around 5.4x. However, investors might be overlooking a clear opportunity or potential setback if there is no rational basis for the P/S.
Check out our latest analysis for Paxman

What Does Paxman's Recent Performance Look Like?
Recent times have been advantageous for Paxman as its revenues have been rising faster than most other companies. Perhaps the market is expecting this level of performance to taper off, keeping the P/S from soaring. If the company manages to stay the course, then investors should be rewarded with a share price that matches its revenue figures.
Keen to find out how analysts think Paxman's future stacks up against the industry? In that case, our free report is a great place to start.What Are Revenue Growth Metrics Telling Us About The P/S?
The only time you'd be comfortable seeing a P/S like Paxman's is when the company's growth is tracking the industry closely.
If we review the last year of revenue growth, the company posted a terrific increase of 36%. The latest three year period has also seen an excellent 194% overall rise in revenue, aided by its short-term performance. So we can start by confirming that the company has done a great job of growing revenue over that time.
Turning to the outlook, the next year should generate growth of 35% as estimated by the sole analyst watching the company. Meanwhile, the rest of the industry is forecast to expand by 34%, which is not materially different.
With this information, we can see why Paxman is trading at a fairly similar P/S to the industry. Apparently shareholders are comfortable to simply hold on while the company is keeping a low profile.
What We Can Learn From Paxman's P/S?
Paxman appears to be back in favour with a solid price jump bringing its P/S back in line with other companies in the industry We'd say the price-to-sales ratio's power isn't primarily as a valuation instrument but rather to gauge current investor sentiment and future expectations.
A Paxman's P/S seems about right to us given the knowledge that analysts are forecasting a revenue outlook that is similar to the Medical Equipment industry. Right now shareholders are comfortable with the P/S as they are quite confident future revenue won't throw up any surprises. Unless these conditions change, they will continue to support the share price at these levels.
Before you take the next step, you should know about the 1 warning sign for Paxman that we have uncovered.
Of course, profitable companies with a history of great earnings growth are generally safer bets. So you may wish to see this free collection of other companies that have reasonable P/E ratios and have grown earnings strongly.
New: Manage All Your Stock Portfolios in One Place
We've created the ultimate portfolio companion for stock investors, and it's free.
• Connect an unlimited number of Portfolios and see your total in one currency
• Be alerted to new Warning Signs or Risks via email or mobile
• Track the Fair Value of your stocks
Have feedback on this article? Concerned about the content? Get in touch with us directly. Alternatively, email editorial-team (at) simplywallst.com.
This article by Simply Wall St is general in nature. We provide commentary based on historical data and analyst forecasts only using an unbiased methodology and our articles are not intended to be financial advice. It does not constitute a recommendation to buy or sell any stock, and does not take account of your objectives, or your financial situation. We aim to bring you long-term focused analysis driven by fundamental data. Note that our analysis may not factor in the latest price-sensitive company announcements or qualitative material. Simply Wall St has no position in any stocks mentioned.
Have feedback on this article? Concerned about the content? Get in touch with us directly. Alternatively, email editorial-team@simplywallst.com
About OM:PAX
Paxman
Develops and sells Paxman scalp cooling system to minimize hair loss in connection with chemotherapy treatment worldwide.
High growth potential with excellent balance sheet.
Similar Companies
Market Insights
Community Narratives


Recently Updated Narratives


MINISO's fair value is projected at 26.69 with an anticipated PE ratio shift of 20x


The Quiet Giant That Became AI’s Power Grid


Nova Ljubljanska Banka d.d will expect a 11.2% revenue boost driving future growth
Popular Narratives


The company that turned a verb into a global necessity and basically runs the modern internet, digital ads, smartphones, maps, and AI.


MicroVision will explode future revenue by 380.37% with a vision towards success


