Stock Analysis


There are a few key trends to look for if we want to identify the next multi-bagger. Firstly, we'd want to identify a growing return on capital employed (ROCE) and then alongside that, an ever-increasing base of capital employed. This shows us that it's a compounding machine, able to continually reinvest its earnings back into the business and generate higher returns. With that in mind, we've noticed some promising trends at Arjo (STO:ARJO B) so let's look a bit deeper.
Return On Capital Employed (ROCE): What is it?
Just to clarify if you're unsure, ROCE is a metric for evaluating how much pre-tax income (in percentage terms) a company earns on the capital invested in its business. The formula for this calculation on Arjo is:
Return on Capital Employed = Earnings Before Interest and Tax (EBIT) ÷ (Total Assets - Current Liabilities)
0.13 = kr1.1b ÷ (kr14b - kr5.3b) (Based on the trailing twelve months to September 2021).
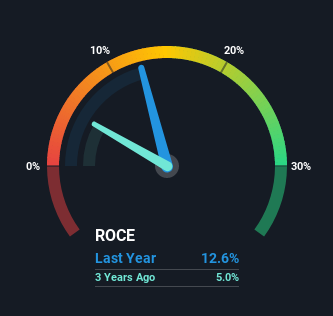
Therefore, Arjo has an ROCE of 13%. In absolute terms, that's a pretty normal return, and it's somewhat close to the Medical Equipment industry average of 12%.
See our latest analysis for Arjo
In the above chart we have measured Arjo's prior ROCE against its prior performance, but the future is arguably more important. If you're interested, you can view the analysts predictions in our free report on analyst forecasts for the company.
So How Is Arjo's ROCE Trending?
We're pretty happy with how the ROCE has been trending at Arjo. The figures show that over the last five years, returns on capital have grown by 68%. That's a very favorable trend because this means that the company is earning more per dollar of capital that's being employed. In regards to capital employed, Arjo appears to been achieving more with less, since the business is using 25% less capital to run its operation. If this trend continues, the business might be getting more efficient but it's shrinking in terms of total assets.
On a side note, we noticed that the improvement in ROCE appears to be partly fueled by an increase in current liabilities. Effectively this means that suppliers or short-term creditors are now funding 37% of the business, which is more than it was five years ago. Keep an eye out for future increases because when the ratio of current liabilities to total assets gets particularly high, this can introduce some new risks for the business.
The Bottom Line On Arjo's ROCE
From what we've seen above, Arjo has managed to increase it's returns on capital all the while reducing it's capital base. And a remarkable 297% total return over the last three years tells us that investors are expecting more good things to come in the future. Therefore, we think it would be worth your time to check if these trends are going to continue.
One more thing to note, we've identified 1 warning sign with Arjo and understanding it should be part of your investment process.
While Arjo may not currently earn the highest returns, we've compiled a list of companies that currently earn more than 25% return on equity. Check out this free list here.
Valuation is complex, but we're helping make it simple.
Find out whether Arjo is potentially over or undervalued by checking out our comprehensive analysis, which includes fair value estimates, risks and warnings, dividends, insider transactions and financial health.
View the Free AnalysisHave feedback on this article? Concerned about the content? Get in touch with us directly. Alternatively, email editorial-team (at) simplywallst.com.
This article by Simply Wall St is general in nature. We provide commentary based on historical data and analyst forecasts only using an unbiased methodology and our articles are not intended to be financial advice. It does not constitute a recommendation to buy or sell any stock, and does not take account of your objectives, or your financial situation. We aim to bring you long-term focused analysis driven by fundamental data. Note that our analysis may not factor in the latest price-sensitive company announcements or qualitative material. Simply Wall St has no position in any stocks mentioned.
About OM:ARJO B
Arjo
Develops and sells medical devices and solutions for patients for clinical and financial outcomes for healthcare in Europe, Asia and Pacific, South America, Africa, and internationally.
Undervalued with reasonable growth potential.
