- Sweden
- /
- Medical Equipment
- /
- OM:ADDV A
The total return for ADDvise Group (STO:ADDV A) investors has risen faster than earnings growth over the last three years


ADDvise Group AB (publ) (STO:ADDV A) shareholders might understandably be very concerned that the share price has dropped 31% in the last quarter. But over the last three years the stock has shone bright like a diamond. In fact, the share price has taken off in that time, up 710%. So the recent fall doesn't do much to dampen our respect for the business. The share price action could signify that the business itself is dramatically improved, in that time. It really delights us to see such great share price performance for investors.
In light of the stock dropping 12% in the past week, we want to investigate the longer term story, and see if fundamentals have been the driver of the company's positive three-year return.
Check out our latest analysis for ADDvise Group
To paraphrase Benjamin Graham: Over the short term the market is a voting machine, but over the long term it's a weighing machine. By comparing earnings per share (EPS) and share price changes over time, we can get a feel for how investor attitudes to a company have morphed over time.
During three years of share price growth, ADDvise Group achieved compound earnings per share growth of 65% per year. This EPS growth is lower than the 101% average annual increase in the share price. So it's fair to assume the market has a higher opinion of the business than it did three years ago. It's not unusual to see the market 're-rate' a stock, after a few years of growth.
The company's earnings per share (over time) is depicted in the image below (click to see the exact numbers).
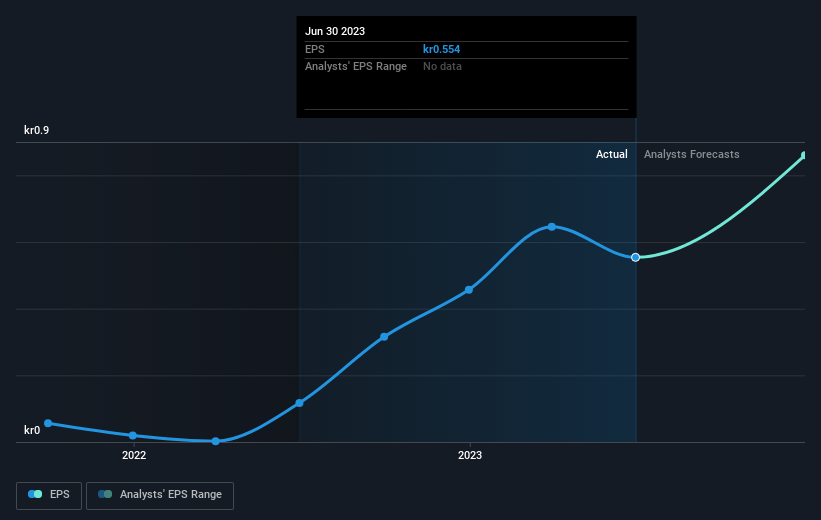
It is of course excellent to see how ADDvise Group has grown profits over the years, but the future is more important for shareholders. It might be well worthwhile taking a look at our free report on how its financial position has changed over time.
What About The Total Shareholder Return (TSR)?
We'd be remiss not to mention the difference between ADDvise Group's total shareholder return (TSR) and its share price return. The TSR is a return calculation that accounts for the value of cash dividends (assuming that any dividend received was reinvested) and the calculated value of any discounted capital raisings and spin-offs. Its history of dividend payouts mean that ADDvise Group's TSR of 714% over the last 3 years is better than the share price return.
A Different Perspective
It's nice to see that ADDvise Group shareholders have received a total shareholder return of 115% over the last year. Since the one-year TSR is better than the five-year TSR (the latter coming in at 41% per year), it would seem that the stock's performance has improved in recent times. Given the share price momentum remains strong, it might be worth taking a closer look at the stock, lest you miss an opportunity. It's always interesting to track share price performance over the longer term. But to understand ADDvise Group better, we need to consider many other factors. Like risks, for instance. Every company has them, and we've spotted 3 warning signs for ADDvise Group (of which 2 are concerning!) you should know about.
If you are like me, then you will not want to miss this free list of growing companies that insiders are buying.
Please note, the market returns quoted in this article reflect the market weighted average returns of stocks that currently trade on Swedish exchanges.
New: Manage All Your Stock Portfolios in One Place
We've created the ultimate portfolio companion for stock investors, and it's free.
• Connect an unlimited number of Portfolios and see your total in one currency
• Be alerted to new Warning Signs or Risks via email or mobile
• Track the Fair Value of your stocks
Have feedback on this article? Concerned about the content? Get in touch with us directly. Alternatively, email editorial-team (at) simplywallst.com.
This article by Simply Wall St is general in nature. We provide commentary based on historical data and analyst forecasts only using an unbiased methodology and our articles are not intended to be financial advice. It does not constitute a recommendation to buy or sell any stock, and does not take account of your objectives, or your financial situation. We aim to bring you long-term focused analysis driven by fundamental data. Note that our analysis may not factor in the latest price-sensitive company announcements or qualitative material. Simply Wall St has no position in any stocks mentioned.
About OM:ADDV A
ADDvise Group
Supplies equipment to healthcare and research facilities in private and public sectors in Sweden, rest of Europe, North America, Africa, and Asia.
Good value with acceptable track record.
