- Sweden
- /
- Construction
- /
- OM:NCC B
NCC AB (publ)'s (STO:NCC B) Stock's On An Uptrend: Are Strong Financials Guiding The Market?


NCC's (STO:NCC B) stock is up by a considerable 16% over the past three months. Since the market usually pay for a company’s long-term fundamentals, we decided to study the company’s key performance indicators to see if they could be influencing the market. In this article, we decided to focus on NCC's ROE.
Return on equity or ROE is a key measure used to assess how efficiently a company's management is utilizing the company's capital. Put another way, it reveals the company's success at turning shareholder investments into profits.
View our latest analysis for NCC
How Do You Calculate Return On Equity?
The formula for return on equity is:
Return on Equity = Net Profit (from continuing operations) ÷ Shareholders' Equity
So, based on the above formula, the ROE for NCC is:
19% = kr1.4b ÷ kr7.2b (Based on the trailing twelve months to June 2024).
The 'return' is the income the business earned over the last year. That means that for every SEK1 worth of shareholders' equity, the company generated SEK0.19 in profit.
What Is The Relationship Between ROE And Earnings Growth?
Thus far, we have learned that ROE measures how efficiently a company is generating its profits. Based on how much of its profits the company chooses to reinvest or "retain", we are then able to evaluate a company's future ability to generate profits. Assuming all else is equal, companies that have both a higher return on equity and higher profit retention are usually the ones that have a higher growth rate when compared to companies that don't have the same features.
A Side By Side comparison of NCC's Earnings Growth And 19% ROE
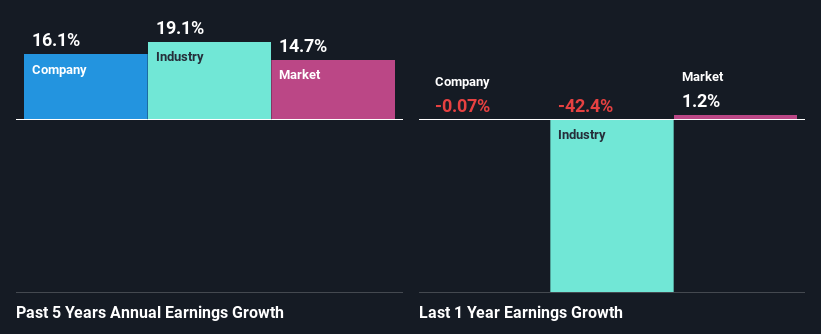
To begin with, NCC seems to have a respectable ROE. On comparing with the average industry ROE of 8.1% the company's ROE looks pretty remarkable. This certainly adds some context to NCC's decent 16% net income growth seen over the past five years.
We then performed a comparison between NCC's net income growth with the industry, which revealed that the company's growth is similar to the average industry growth of 19% in the same 5-year period.
The basis for attaching value to a company is, to a great extent, tied to its earnings growth. It’s important for an investor to know whether the market has priced in the company's expected earnings growth (or decline). By doing so, they will have an idea if the stock is headed into clear blue waters or if swampy waters await. Is NCC fairly valued compared to other companies? These 3 valuation measures might help you decide.
Is NCC Using Its Retained Earnings Effectively?
NCC has a healthy combination of a moderate three-year median payout ratio of 44% (or a retention ratio of 56%) and a respectable amount of growth in earnings as we saw above, meaning that the company has been making efficient use of its profits.
Moreover, NCC is determined to keep sharing its profits with shareholders which we infer from its long history of paying a dividend for at least ten years. Upon studying the latest analysts' consensus data, we found that the company's future payout ratio is expected to rise to 55% over the next three years. However, the company's ROE is not expected to change by much despite the higher expected payout ratio.
Summary
In total, we are pretty happy with NCC's performance. Specifically, we like that the company is reinvesting a huge chunk of its profits at a high rate of return. This of course has caused the company to see substantial growth in its earnings. With that said, the latest industry analyst forecasts reveal that the company's earnings growth is expected to slow down. Are these analysts expectations based on the broad expectations for the industry, or on the company's fundamentals? Click here to be taken to our analyst's forecasts page for the company.
Valuation is complex, but we're here to simplify it.
Discover if NCC might be undervalued or overvalued with our detailed analysis, featuring fair value estimates, potential risks, dividends, insider trades, and its financial condition.
Access Free AnalysisHave feedback on this article? Concerned about the content? Get in touch with us directly. Alternatively, email editorial-team (at) simplywallst.com.
This article by Simply Wall St is general in nature. We provide commentary based on historical data and analyst forecasts only using an unbiased methodology and our articles are not intended to be financial advice. It does not constitute a recommendation to buy or sell any stock, and does not take account of your objectives, or your financial situation. We aim to bring you long-term focused analysis driven by fundamental data. Note that our analysis may not factor in the latest price-sensitive company announcements or qualitative material. Simply Wall St has no position in any stocks mentioned.
Have feedback on this article? Concerned about the content? Get in touch with us directly. Alternatively, email editorial-team@simplywallst.com
About OM:NCC B
NCC
Operates as a construction company in Sweden, Norway, Denmark, and Finland.
Excellent balance sheet and fair value.
